
When sizing up a potential real estate investment, the capitalization rate, or cap rate for short, is one of the most critical metrics you'll encounter. It's a straightforward calculation that provides a clear look at a property's potential return, telling you what you could earn in a year if you bought it with all cash.
Think of it as the property's raw, unleveraged yield. This simple percentage helps investors quickly compare different opportunities and get a sense of their profitability and risk without the complexities of financing. For anyone serious about building wealth through property, understanding cap rate isn't just helpful—it's essential.
In This Guide
- 1 Decoding Cap Rate: A Core Investor Metric
- 2 How to Accurately Calculate Cap Rate
- 3 What Is a Good Cap Rate in Today's Market?
- 4 Understanding Cap Rate Versus Other Investment Metrics
- 5 Common Pitfalls and Nuances of Using Cap Rate
- 6 Frequently Asked Questions (FAQ) About Cap Rate
- 6.1 1. How do interest rates affect cap rates?
- 6.2 2. Is a higher cap rate always better?
- 6.3 3. What is the difference between cap rate and ROI?
- 6.4 4. Can a cap rate be negative?
- 6.5 5. Where can I find reliable cap rate data?
- 6.6 6. How does vacancy affect the cap rate calculation?
- 6.7 7. Why isn't a mortgage payment included in NOI?
- 6.8 8. What is cap rate compression and expansion?
- 6.9 9. How can I use cap rate to estimate property value?
- 6.10 10. What is a "pro-forma" cap rate?
Decoding Cap Rate: A Core Investor Metric
So, what is the cap rate really telling you? Imagine it as a property's financial pulse. It shows how hard your investment is working for you by measuring its income relative to its market value.
By stripping away the details of financing—like your specific mortgage interest rate or down payment—the cap rate gives you an apples-to-apples comparison. It focuses solely on the property's operational performance, which is exactly what you need when you're trying to decide between different deals.
For example, it's tough to directly compare a $1 million property to a $5 million one. But if you know one has a 5% cap rate and the other has a 7% cap rate, you instantly have a standardized benchmark to guide your analysis.
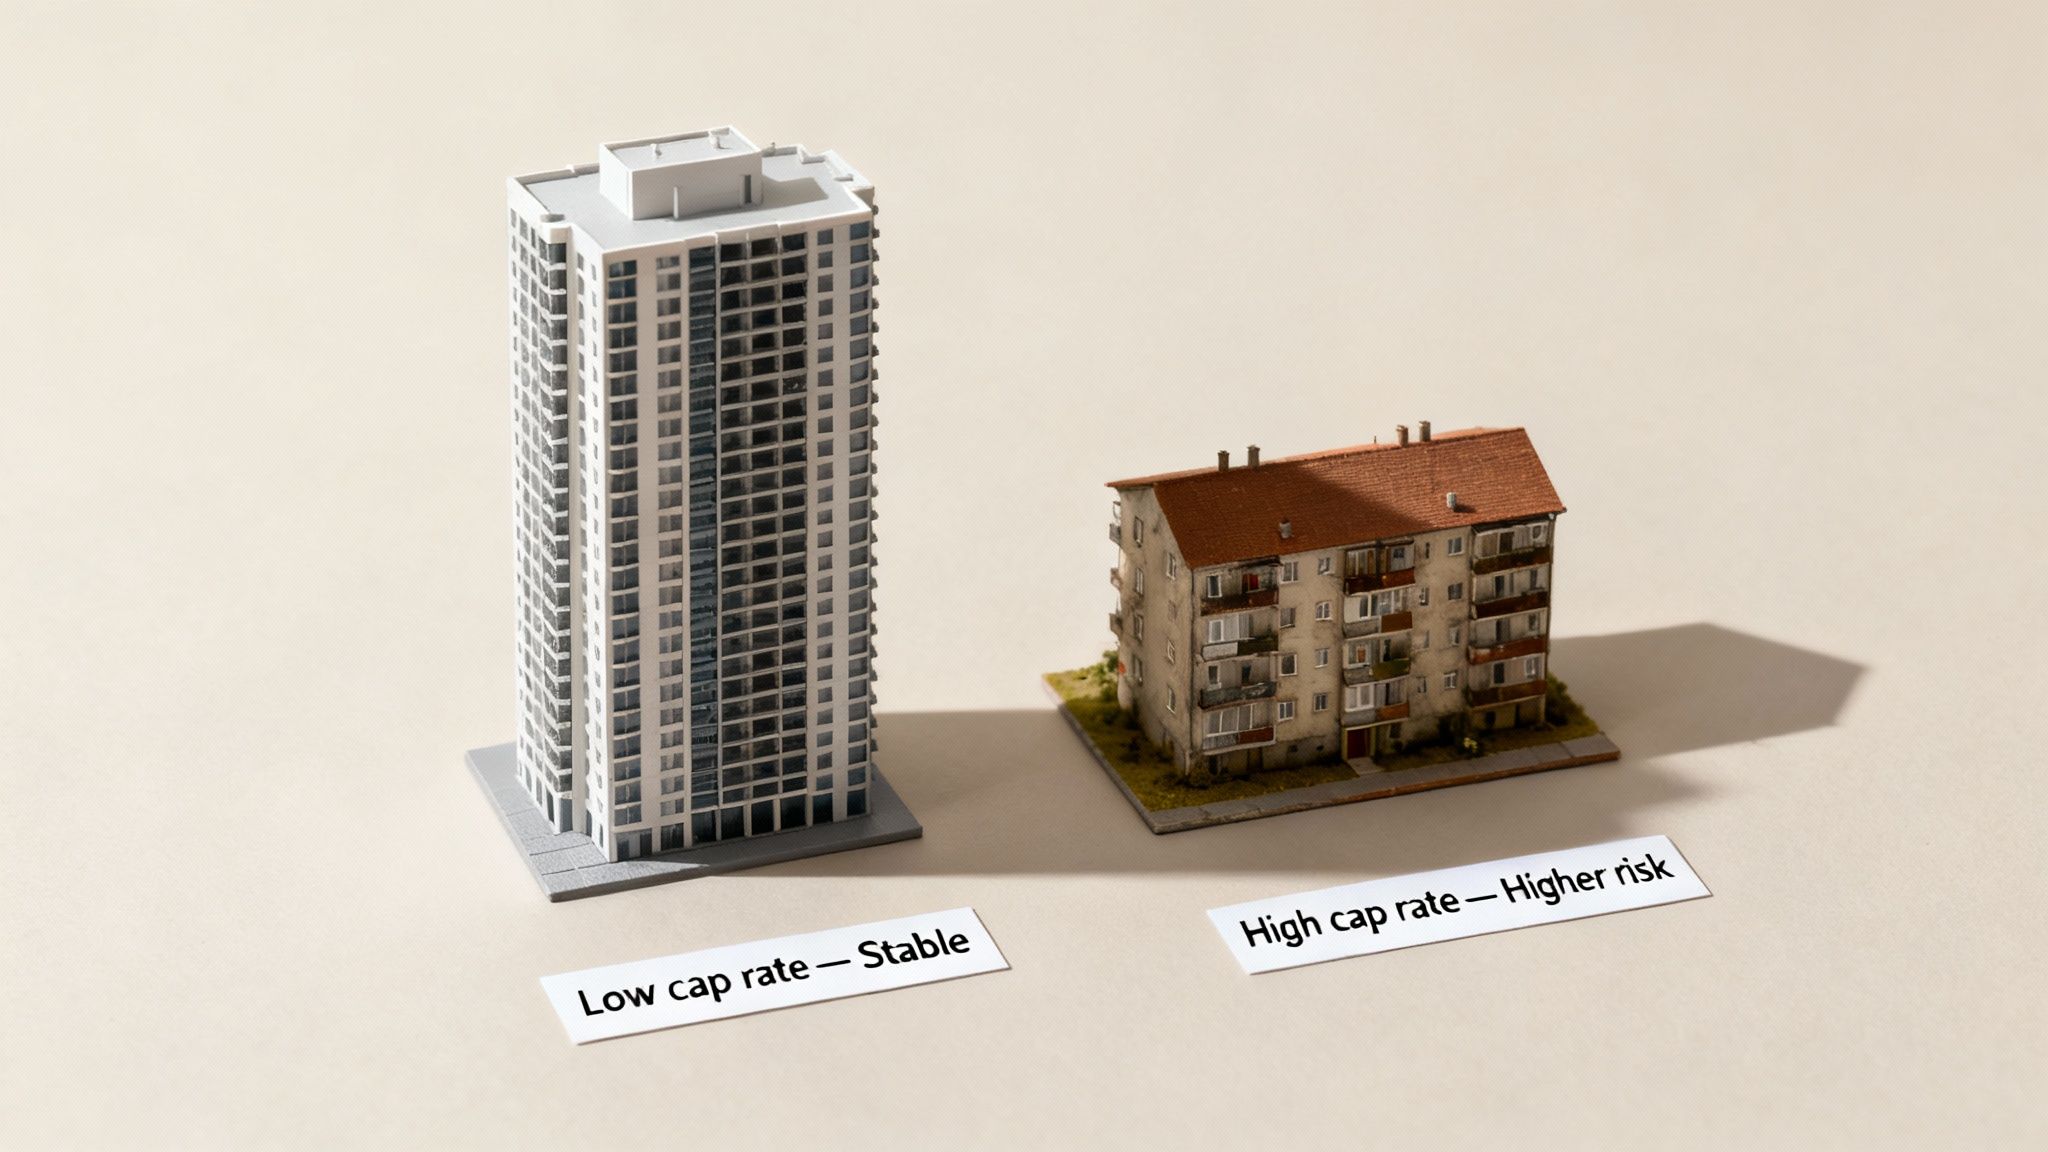
The Relationship Between Risk and Return
A cap rate isn't just about potential profit; it's also a powerful signal of risk. Understanding this dynamic is key to interpreting what a cap rate really means.
-
Lower Cap Rate (e.g., 4-6%): This usually points to a lower-risk investment. Think of properties in prime, high-demand areas, with long-term, stable tenants and little need for repairs. Investors are often willing to pay more for this kind of stability, which pushes the property value up and, in turn, brings the cap rate down.
-
Higher Cap Rate (e.g., 8-12%): This often signals a higher level of risk, but also the potential for a higher reward. These properties might be in up-and-coming neighborhoods, need some work, or have less predictable rental income. The higher cap rate is the market’s way of compensating an investor for taking on that extra uncertainty.
An experienced investor knows that a high cap rate isn't automatically a "good" deal, just as a low one isn't "bad." It’s all about finding the right balance of risk and reward that fits your personal investment strategy.
The Universal Language of Real Estate
At the end of the day, cap rate is the common language spoken by everyone in the real estate world, from brokers and appraisers to investors like you. It’s a quick, data-backed snapshot that cuts through the noise and gets right to the heart of a property’s financial performance.
Mastering this one number allows you to quickly gauge an asset's income potential and its standing in the market. It's the foundation for making smart, confident decisions and building a successful real estate portfolio.
How to Accurately Calculate Cap Rate
The beauty of the cap rate is its simplicity. It boils a complex investment down to a single, easy-to-compare percentage. The formula itself is straightforward: Net Operating Income (NOI) divided by the property’s current market value. But the real art is in getting the numbers right, especially the NOI.
Think of Net Operating Income as the raw, unfiltered earning power of a property over a year. It's all the cash the property generates before you even think about your mortgage. Nailing this number is the most important part of the whole process.
Step 1: Pinpoint Your Net Operating Income
To find the NOI, you simply take all the money the property could potentially make and subtract what it costs to keep it running. This is where you need to be a stickler for details.
First, figure out your Gross Rental Income. This isn't just rent. It should include:
- All the rent you’d collect from tenants over a full year.
- Any extra income streams, like fees for parking, laundry machines, or pets.
Next, you need to subtract your Operating Expenses. These are the non-negotiable costs of keeping the lights on and the tenants happy. Be sure to include things like:
- Property taxes
- Homeowners or property insurance
- Regular maintenance and repairs
- Property management fees
- Utilities (if you're the one paying them)
- A realistic budget for vacancy (seasoned investors often use 5-10% of gross income)
Here’s a common rookie mistake: including your mortgage payment. Never include your loan principal or interest in the NOI calculation. The cap rate is meant to measure the property's performance on its own, completely separate from how you financed it.
Step 2: Determine the Property Value
The other half of the formula is the property's value. For a truly accurate cap rate, you need to use the current market value, not what you paid for it years ago. Real estate markets move, and using an old purchase price will give you a useless, misleading number.
You can find the current value from a recent appraisal or by doing your own homework and looking at recent sales of similar properties (often called "comps") in the area.
This simple graphic breaks down how you go from raw property data to a clean cap rate percentage, showing the flow from analysis to the final number.
Step 3: Putting It All Together – A Real-World Example
Let's walk through an example to make this crystal clear. Imagine you're looking at a small apartment building on the market.
Property Details:
- Current Market Value: $1,000,000
- Annual Gross Rental Income: $80,000
- Annual Operating Expenses: $30,000 (this includes taxes, insurance, maintenance, and a 5% vacancy allowance)
First, let's get that NOI:
NOI = $80,000 (Gross Income) – $30,000 (Operating Expenses) = $50,000
Now, just plug it into the cap rate formula:
Cap Rate = $50,000 (NOI) / $1,000,000 (Market Value) = 0.05 or 5%
That 5% cap rate is your benchmark. It's a clean, standardized number you can use to compare this building against any other investment you're considering. If you want to play with the numbers and see how different expenses impact your bottom line, a good real estate investment calculator can be an invaluable tool.
Keep in mind, these numbers don't exist in a vacuum. A property with a $500,000 NOI valued at $8 million has a 6.25% cap rate. But right after the 2008 financial crisis, when NOI dropped and money got tight, it wasn't uncommon to see cap rates jump to 8-9%. By 2023, things settled down, and major markets like NYC and London saw cap rates hovering between 4-6%, proving just how much economic health and capital flows can influence property returns.
What Is a Good Cap Rate in Today's Market?
So you've run the numbers and calculated a cap rate. The big question now is, "Is this any good?" Honestly, there’s no single magic number that works for every deal. What makes a cap rate "good" comes down to the context—the type of property, its location, and what’s happening in the broader economy.
The real skill isn’t just calculating the number, but learning to read the story it tells. A cap rate is far more than a simple return metric; think of it as a sophisticated risk gauge. A low cap rate isn't automatically a bad thing, just as a high one isn't always a home run. It's all about matching the risk and return profile with your personal investment goals.
Location and Property Type Drive Everything
The two most powerful forces shaping a "good" cap rate are where the property is and what kind of building it is. You would have vastly different expectations for a shiny downtown office tower compared to a garden-style apartment complex in the suburbs.
Let's say you're looking at a modern apartment building in a major city like San Francisco. In a hot market like that, cap rates often hover in the 4% to 5% range. Why so low? Because investors are willing to pay a premium for the stability, high tenant demand, and predictable cash flow that come with prime real estate. If a building there generates $5 million in NOI and the market values it at $100 million, you get a crisp 5% cap rate.
Now, picture a similar property in a smaller, secondary city. It might boast a cap rate of 8% or higher. The potential for higher cash flow is tempting, but it comes with more risk. The local economy might rely on a single industry, tenant demand could be less certain, and property values might not appreciate as quickly. Your choice between them boils down to your strategy: are you hunting for stable, long-term growth or do you need higher cash flow right now?
The golden rule of cap rate analysis is that risk and return are two sides of the same coin. Investors demand higher returns (higher cap rates) to compensate for taking on greater uncertainty.
A Comparative Look at Cap Rate Benchmarks
To give you a better feel for this, let's look at some typical cap rate ranges across different types of commercial real estate. Keep in mind these are general benchmarks and will fluctuate with market conditions, but they offer a solid starting point for evaluating a deal.
Here’s a comparative look at average cap rates to help you understand what's typical for different asset classes.
Typical Cap Rate Ranges by Property Type and Market
| Asset Class / Market Type | Typical Cap Rate Range | Associated Risk Level |
|---|---|---|
| Multifamily (Urban Core) | 4% – 5.5% | Low |
| Industrial Warehouse | 5% – 6.5% | Low to Moderate |
| Retail (Grocery-Anchored) | 6% – 7.5% | Moderate |
| Office (Suburban) | 7% – 8.5% | Moderate to High |
| Hospitality (Hotel) | 8% – 10%+ | High |
As the table shows, property types with steady, reliable income—like multifamily apartments in a big city—tend to have lower cap rates because they are seen as safer bets. On the other hand, assets like hotels, which are very sensitive to economic swings, have to offer much higher cap rates to entice investors to take on that extra risk.
Understanding where a property fits within these benchmarks helps you spot whether a deal is priced fairly for its market. Our guide on the best cities for rental properties dives even deeper into how location can make or break an investment.
Real-Life Scenario: Comparing Two Apartment Buildings
Let's walk through a quick comparison to see how this works in practice. An investor is considering two apartment buildings.
| Metric | Property A: "The Urban" | Property B: "The Suburban" | Analysis |
|---|---|---|---|
| Location | Downtown Austin, TX | Suburb of Detroit, MI | High-growth, stable market vs. a slower, less predictable market. |
| NOI | $225,000 | $240,000 | The Suburban generates slightly more income. |
| Asking Price | $5,000,000 | $3,000,000 | The Urban has a much higher market valuation. |
| Calculated Cap Rate | 4.5% | 8.0% | A significant difference in perceived return and risk. |
| Implied Risk | Lower risk. High tenant demand from a booming tech sector and strong potential for appreciation. | Higher risk. The local economy is less diverse, and future appreciation is less certain. |
At first glance, Property B's 8% cap rate looks far more attractive. But a seasoned investor sees the full story. The Urban's 4.5% cap rate reflects market confidence in Austin's strong economy. It suggests stable tenancy, reliable rent growth, and significant long-term appreciation potential. It's a lower-risk play for wealth preservation and growth.
The Suburban's 8% cap rate is a "risk premium." The market is offering a higher return to compensate for the risks of a less dynamic economy and uncertain future. While it offers better immediate cash flow, its long-term value could stagnate or even decline. In this case, the lower cap rate likely points to the smarter, safer investment for building lasting wealth.
This article is for educational purposes only and is not financial or investment advice. Consult a professional before making financial decisions.
Understanding Cap Rate Versus Other Investment Metrics
While the cap rate is a fantastic tool for a quick side-by-side comparison of properties, relying on it alone is like trying to build a house with only a hammer. A seasoned investor knows it's just one piece of a much bigger puzzle. To get the full story on an investment's potential, you need to see how it performs against other key financial metrics.
Each metric reveals a different side of the investment, and knowing which one to use—and when—is what separates the pros from the amateurs. Cap rate is your go-to for measuring a property’s raw, unleveraged income potential. But other metrics are designed to show you what really happens once financing and your own cash enter the picture.
Cap Rate vs. Cash-on-Cash Return
This is probably the most critical distinction for any real estate investor to get right. Cap rate completely ignores financing, but Cash-on-Cash Return puts your actual cash investment and mortgage payments front and center.
- Cap Rate: Tells you how the property performs on its own, independent of the buyer.
- Cash-on-Cash Return: Shows you the personal return you're making on the money you actually pulled out of your pocket.
Let's walk through a quick example. Imagine you buy a $1,000,000 property with an NOI of $60,000. That gives you a solid 6% cap rate.
Now, watch what happens when we introduce a mortgage. You put down $200,000 (a 20% down payment), and your annual mortgage payments total $45,000. Your pre-tax cash flow is your NOI minus that debt service: $60,000 – $45,000 = $15,000.
To find your Cash-on-Cash Return, you divide that cash flow by the cash you invested: $15,000 / $200,000 = 7.5%.
See that? By using leverage, you boosted your personal return from the property's base 6% cap rate to a 7.5% cash-on-cash return. This is exactly why this metric is so important—it shows how hard your capital is actually working for you.
Other Key Performance Indicators
Beyond cash-on-cash, two other metrics give you an even broader perspective on an investment’s performance over its entire life: Return on Investment (ROI) and Internal Rate of Return (IRR).
The best investors build a dashboard of metrics. They use cap rate for the initial sniff test, cash-on-cash to see how a deal works with their financing, and ROI or IRR to project long-term profitability.
Each one has a specific job, and understanding what they do—and don't do—is the secret to a rock-solid analysis.
| Metric | What It Measures | When to Use It | Key Limitation |
|---|---|---|---|
| Cap Rate | A property's unleveraged annual return from income. | Comparing the raw operational performance of multiple properties. | Ignores financing and future appreciation. |
| Cash-on-Cash | The annual pre-tax cash flow relative to your actual cash invested. | Evaluating the efficiency of your down payment and the impact of leverage. | Doesn't account for property appreciation or loan principal paydown. |
| ROI | The total return (income + appreciation) over the entire investment period. | Getting a big-picture view of total profitability after selling a property. | Doesn't account for the time value of money. |
| IRR | The annualized rate of return, considering the timing of all cash flows. | Comparing complex investments with irregular cash flows over different timeframes. | Can be complex to calculate and may produce multiple results. |
Think of cap rate as your starting point for judging a property’s income stream. But metrics like ROI give you a more complete picture by factoring in the profit you make from appreciation when you eventually sell. To really get a handle on that, take a look at our guide on how to calculate return on investment, which breaks the whole thing down.
Ultimately, using these metrics together helps you move from just analyzing a property to building a true investment strategy. This multi-faceted approach ensures you're not just buying a building, but making a sound financial decision that lines up perfectly with your long-term goals.
This article is for educational purposes only and is not financial or investment advice. Consult a professional before making financial decisions.
Common Pitfalls and Nuances of Using Cap Rate
A cap rate is a fantastic tool for getting a quick read on a real estate deal, but it's only as reliable as the numbers you plug into it. One of the fastest ways to overpay for a property is to simply trust the seller's advertised cap rate without doing your own homework. Far too many investors get tripped up by accepting the provided numbers at face value, a mistake that can be incredibly costly.
The metric's biggest strength—its simplicity—is also its greatest weakness. It gives you a single, clean percentage that can easily mask serious underlying issues with a property's financial health. To use cap rate effectively, you have to put on your detective hat and look for the clues that tell the real story behind the numbers.
Pro-Forma vs. Trailing Cap Rates
One of the most common traps investors fall into is the difference between a trailing cap rate and a pro-forma cap rate. It's absolutely critical to know which one you're looking at, because they tell two completely different stories.
- Trailing Cap Rate: This is based on the property’s actual, historical performance—usually over the last 12 months. It’s grounded in reality and shows what the asset has actually done.
- Pro-Forma Cap Rate: This is a forward-looking guess based on projected, and often highly optimistic, assumptions. A seller will use a pro-forma to show what the property could earn if rents were jacked up, every unit was full, and expenses magically shrank.
While a pro-forma can be useful for planning a value-add project, you have to treat it with a healthy dose of skepticism. Always demand the historical data—the trailing 12-month financials—to establish a baseline you can actually trust.
The Problem with a Seller-Provided NOI
The Net Operating Income (NOI) is the engine of the cap rate formula, and it's precisely where numbers get massaged the most. An inflated NOI creates an artificially attractive—and deeply misleading—cap rate. You have to conduct your own due diligence to verify every single line item.
Remember, a seller's goal is to present their property in the best possible light. Your goal is to uncover the truth. Assume nothing and verify everything.
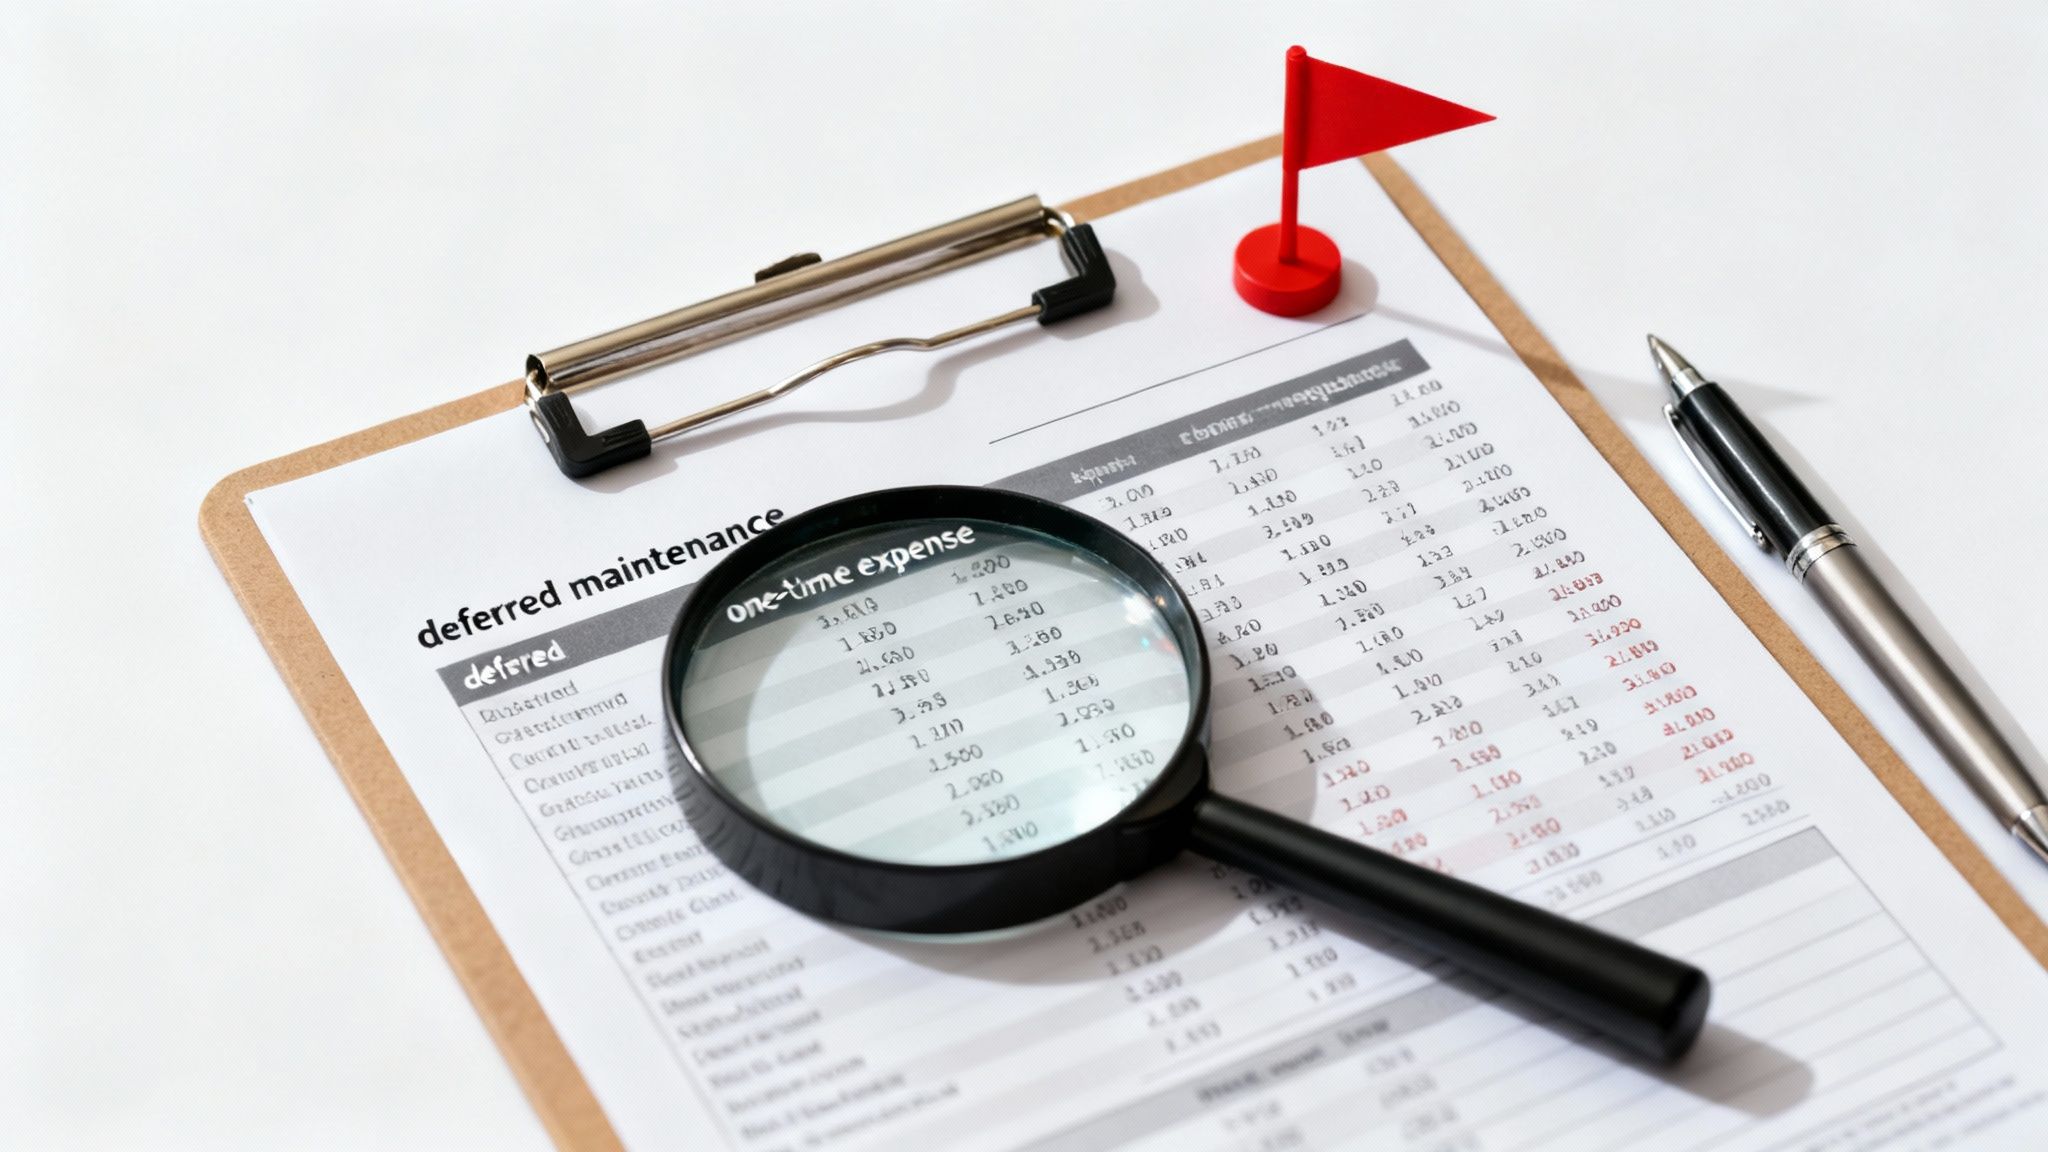
Keep a sharp eye out for these common NOI red flags:
- Deferred Maintenance: An owner might delay essential repairs for a year just to make their expense report look good. That leaky roof or ancient HVAC system will quickly become your expensive headache.
- Below-Market Vacancy: The seller might boast a 2% vacancy rate, but a quick check reveals the market average is closer to 7%. A proper NOI calculation must use a realistic vacancy allowance based on hard market data, not wishful thinking.
- "Forgotten" Expenses: Watch out for missing line items. Did they conveniently forget to include property management fees because they manage it themselves? Or perhaps they left out recurring costs for things like landscaping, pest control, or professional services.
A deep, thorough analysis of the property's real-world expenses is non-negotiable. Our complete real estate due diligence checklist can give you a structured framework for this crucial process. By digging into the financials and challenging every assumption, you can build an accurate NOI and calculate a cap rate that reflects the property's true potential, not just its sales pitch.
Frequently Asked Questions (FAQ) About Cap Rate
1. How do interest rates affect cap rates?
There is typically an inverse relationship. When interest rates rise, borrowing becomes more expensive, which can cool buyer demand and push property prices down. If prices fall while income (NOI) remains the same, cap rates go up (this is called "cap rate expansion"). Conversely, when interest rates fall, property prices often rise, causing cap rates to go down ("cap rate compression").
2. Is a higher cap rate always better?
Not necessarily. A higher cap rate can indicate a higher potential return, but it often comes with higher risk. This could mean the property is in a less desirable location, requires significant repairs, or has unstable tenancy. A lower cap rate usually signifies a lower-risk, more stable asset. The "best" cap rate depends on your investment strategy and risk tolerance.
3. What is the difference between cap rate and ROI?
Cap rate measures a property's unleveraged annual return based on its income, ignoring financing and appreciation. Return on Investment (ROI) is a much broader metric that calculates the total return (including both income and appreciation) over the entire holding period, relative to the total cost of the investment.
4. Can a cap rate be negative?
Yes, but it's a major red flag. A negative cap rate occurs when a property's annual operating expenses exceed its gross income, resulting in a negative Net Operating Income (NOI). This means the property is losing money from its operations even before factoring in mortgage payments. It typically signals a severely distressed property.
5. Where can I find reliable cap rate data?
Reputable sources include market reports from major commercial real estate brokerage firms (like CBRE, JLL, Cushman & Wakefield), paid data platforms (like CoStar and Reonomy), and insights from local market experts such as commercial brokers, appraisers, and property managers.
6. How does vacancy affect the cap rate calculation?
Vacancy directly reduces a property's income potential. A proper NOI calculation must subtract a realistic vacancy allowance (typically 5-10% of gross income, depending on the market) to be accurate. Be skeptical of seller-provided cap rates that use an unrealistically low or 0% vacancy rate.
7. Why isn't a mortgage payment included in NOI?
The mortgage payment is intentionally excluded because the cap rate is designed to measure the property's intrinsic performance, independent of the buyer's financing structure. This allows for a true "apples-to-apples" comparison between different properties, regardless of how they are purchased.
8. What is cap rate compression and expansion?
Cap Rate Compression occurs when property values rise faster than income, causing cap rates to decrease. This is common in hot, competitive markets. Cap Rate Expansion is the opposite; it happens when property values fall or stagnate while income remains flat, causing cap rates to rise. This is often seen in cooling markets or times of economic uncertainty.
9. How can I use cap rate to estimate property value?
You can rearrange the formula to quickly estimate a property's value using the "income approach": Market Value = Net Operating Income / Cap Rate. If a property has an NOI of $50,000 and similar properties in the area are trading at a 5% cap rate, its estimated value would be $1,000,000 ($50,000 / 0.05).
10. What is a "pro-forma" cap rate?
A pro-forma cap rate is based on future financial projections, not historical performance. Sellers use it to show a property's potential return after planned improvements, such as raising rents or reducing expenses. You should always treat pro-forma numbers with caution and base your analysis on the actual, trailing 12-month financial data. Our guide on is real estate a good investment dives deeper into how valuation fits into a successful strategy.
At Top Wealth Guide, we provide the insights you need to make smarter investment decisions. Explore our resources to build your financial future with confidence.
Learn more at: https://topwealthguide.com
This article is for educational purposes only and is not financial or investment advice. Consult a professional before making financial decisions.