
To understand a company's financial health, you need to examine three key documents: the Income Statement, the Balance Sheet, and the Cash Flow Statement. These aren't just collections of numbers; together, they tell the story of a business—how much money it's making, what it owns and owes, and where its cash really comes from and goes.
In This Guide
The Big Three: Core Financial Statements

Think of financial analysis like a medical check-up for a business. Looking at just one statement is like a doctor only checking your temperature—you get one piece of data, but you miss the full picture of the patient's health.
The real skill comes from seeing how these three reports connect. A big jump in profit on the income statement should ideally show up as more cash on the cash flow statement. Taking out a huge new loan? You'll see that debt appear on the balance sheet and the cash from that loan under financing activities on the cash flow statement. It’s all interconnected.
What Each Statement Reveals
Every statement is designed to answer a different, crucial question about the business. They each provide a unique lens through which to view the company's performance and position.
The Income Statement (P&L)
- What it is: Think of this as a movie of a company's performance over a specific time frame, like a quarter or a full year. It starts with total sales (revenue), subtracts all the costs of doing business, and ends with the famous "bottom line"—net income.
- The big question it answers: Is this business actually profitable?
The Balance Sheet
- What it is: This is a snapshot in time. It shows what a company owns (assets) and what it owes (liabilities) on one specific day. The leftover amount is what belongs to the owners (shareholders' equity).
- The unbreakable rule: It's always governed by the core accounting equation: Assets = Liabilities + Equity.
- The big question it answers: What is the company's net worth and overall financial position right now?
The Cash Flow Statement
- What it is: In my experience, this is often the most revealing report. It tracks the actual cash moving in and out of the business from three areas: operations, investing, and financing. A company can show a profit on paper but still go bankrupt from a lack of cash.
- Why it's crucial: This statement cuts through accounting assumptions and tells you the truth about a company's ability to generate and manage cash. As you'll see when you learn why cash flow management is crucial for wealth building, this is non-negotiable for long-term success.
- The big question it answers: Where did the cash come from, and where did it all go?
To make this even clearer, here's a quick reference table that breaks down the essentials for each statement.
The Three Core Financial Statements at a Glance
| Statement | What It Shows | Key Question Answered | Real-Life Example |
|---|---|---|---|
| Income Statement | Profitability over a period of time (e.g., one year). | "Did the company make money?" | Shows if Apple's iPhone sales last year covered its R&D, marketing, and production costs. |
| Balance Sheet | Financial position at a single point in time. | "What does the company own and owe?" | Reveals how much cash, inventory, and debt Ford had on the last day of the year. |
| Cash Flow Statement | Movement of cash from operating, investing, and financing activities. | "Where did the cash come from and go?" | Tracks the cash Amazon generated from sales versus the cash it spent building new warehouses. |
Remembering what each statement is for will help you zero in on the right information when you start your analysis.
My favorite saying: Profit is an opinion, but cash is a fact. The Income Statement has accounting estimates and accruals, but the Cash Flow Statement follows the actual money. It’s the ultimate reality check.
This trio is the bedrock of any serious financial investigation. Before we get into calculating ratios and spotting trends, getting comfortable with what each of these statements shows—and what it doesn't—is the most important first step you can take.
Spotting Key Trends with Horizontal and Vertical Analysis
Looking at a single financial statement is like seeing one frame of a movie; you get a snapshot, but you completely miss the plot. The real story of a company—its struggles, its triumphs, its direction—only comes to life when you compare its performance over time and peek inside its internal structure.
This is where two powerful techniques, horizontal and vertical analysis, come into play. They are the tools that transform static numbers into a dynamic narrative, helping you spot meaningful trends, identify crucial shifts, and start asking much smarter questions. Think of them as your first real step from just reading financial statements to truly understanding them.
Comparing Performance Over Time with Horizontal Analysis
Horizontal analysis, which you'll often hear called trend analysis, is all about looking at the company's financials from one year to the next. You're literally reading across the page, comparing each line item over multiple periods (like year-over-year or quarter-over-quarter). The goal is to calculate the percentage change, which instantly tells you where the business is growing, stagnating, or shrinking.
It’s one thing to see that revenue was $10 million last year and $12 million this year. But horizontal analysis tells you that revenue grew by 20%. That percentage is far more powerful—it gives you context and a real basis for comparison.
Let's look at a real-world example: Starbucks' revenue.
- In fiscal 2021, Starbucks reported revenue of $29.1 billion.
- In fiscal 2022, they reported revenue of $32.3 billion.
The horizontal analysis is:(($32.3B - $29.1B) / $29.1B) * 100 = 11%growth. This tells us their sales are growing at a healthy double-digit rate.
Understanding Company Structure with Vertical Analysis
While horizontal analysis looks across time, vertical analysis looks up and down a single financial statement for one period. It's about understanding the company's internal DNA by expressing each line item as a percentage of a base figure.
On the income statement, every line is shown as a percentage of Total Revenue. For the balance sheet, each item is a percentage of Total Assets. This process creates what we call a common-size financial statement, and it’s an absolute game-changer for comparing companies of different sizes or tracking how a company's internal structure changes over time.
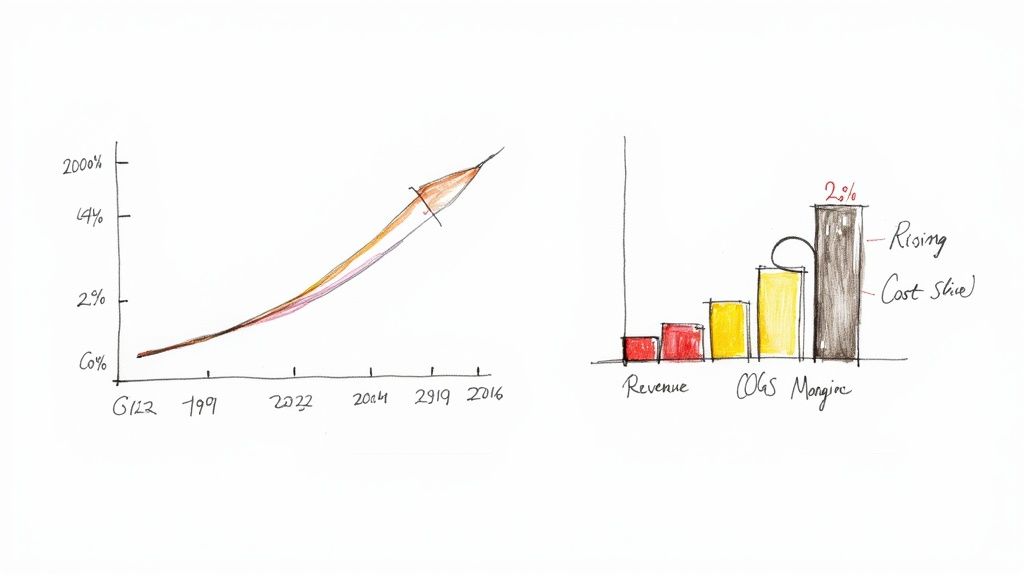
Let's apply this to Nike's income statement for a simplified example:
- Revenue: $44.5 billion (100%)
- Cost of Goods Sold: $24.5 billion (55%)
- Gross Profit: $20.0 billion (45%)
Now we can see that for every dollar in sales, 55 cents went to the cost of their products, leaving them with a 45% gross margin. This common-size data is invaluable for benchmarking Nike against its competitors like Adidas—an essential step in any serious market analysis. To dig deeper into this, you can check out our guide on how to do market research before any investment.
Key Takeaway: Horizontal analysis shows you the direction a company is headed (growth or decline), while vertical analysis reveals its internal efficiency and cost structure. Using them together gives you a much richer, more complete picture of a company's financial health.
Once you get comfortable with these two foundational techniques, you'll have the context you need for the more advanced ratio analysis we’ll get into next.
Using Financial Ratios for Deeper Insights
Alright, you've got the hang of horizontal and vertical analysis. Now it's time to dig into the real meat of financial statement analysis: the ratios. This is where the raw numbers from the income statement, balance sheet, and cash flow statement really start to tell a story.
Think of it this way: knowing a company made $10 billion in revenue doesn't tell you much on its own. Is that good? For a massive industrial firm, maybe not. For a startup, it's incredible. Ratios give us that critical context by turning absolute numbers into standardized metrics, letting you compare that $10 billion giant to a $10 million competitor on an apples-to-apples basis.
We'll group the most important ratios into four families, each one designed to answer a crucial question about the business.
Measuring Short-Term Stability with Liquidity Ratios
First up: can the company pay its bills? Liquidity ratios tackle this simple but vital question by measuring a company's ability to cover its short-term debts (anything due in the next year) with its short-term assets. A cash crunch can sink an otherwise healthy-looking company faster than almost anything else.
Here are the two you'll check constantly:
- Current Ratio: This is your go-to, calculated as Current Assets / Current Liabilities. It’s a quick snapshot of a company's ability to cover its immediate debts. While anything over 1 is a start, what’s considered "good" can vary wildly between industries.
- Quick Ratio (Acid-Test Ratio): For a tougher look, we use the Quick Ratio: (Current Assets – Inventory) / Current Liabilities. It answers the question, "Could this company pay its bills without selling a single item from its inventory?" Since inventory isn't always easy to turn into cash quickly, this gives you a more conservative view of a company's financial footing.
Gauging Performance with Profitability Ratios
This is where you find the headliners—the numbers that show how good a company is at turning revenue into actual profit. These ratios cut right to the chase: is the business truly making money?
These are the big three:
- Gross Profit Margin: Calculated as (Revenue – Cost of Goods Sold) / Revenue, this tells you how much profit the company makes on each sale before overhead. A healthy, stable gross margin is a great sign of pricing power or production efficiency.
- Net Profit Margin: This is the famous "bottom line" ratio: Net Income / Revenue. It shows you what percentage of every dollar in sales is left after all expenses are paid, from salaries and rent to interest and taxes.
- Return on Equity (ROE): My personal favorite. ROE is calculated as Net Income / Shareholder's Equity and it measures how effectively management is using the money investors gave them. A consistently high ROE often points to a fantastic business, and understanding it is fundamental when you learn how to value stocks effectively.
Assessing Risk with Leverage Ratios
Leverage ratios are all about debt. Using debt to grow isn't inherently bad—it can supercharge growth. But too much of it can be a ticking time bomb, especially when the economy sours. These ratios help you figure out if a company's debt is a strategic tool or a major risk.
Keep a close eye on these two:
- Debt-to-Equity Ratio: Simply Total Liabilities / Shareholder's Equity. This shows how much the company relies on borrowing compared to its own capital. A high number isn't an automatic deal-breaker, but it means you need to dig deeper.
- Interest Coverage Ratio: This one, Earnings Before Interest and Taxes (EBIT) / Interest Expense, tells you how easily the company can make its loan payments. If this number drops near 1.5 or below, that’s a serious red flag that the company could be struggling to service its debt.
Evaluating Operations with Efficiency Ratios
Finally, efficiency ratios (or activity ratios) give you a peek under the hood at how well the business is running day-to-day. They measure how effectively a company is using its assets to produce sales and manage its working capital.
Two classics you need to know:
- Inventory Turnover: Calculated as Cost of Goods Sold / Average Inventory, this shows how quickly the company is selling what it produces. A low turnover might mean weak sales or that the warehouses are full of stuff nobody wants.
- Asset Turnover Ratio: This ratio, Revenue / Total Assets, is a big-picture look at how much bang for the buck the company gets from its assets (like factories, equipment, and property). A higher number suggests the company is sweating its assets effectively to generate sales.
Expert Tip: Never, ever look at a ratio in a vacuum. A Current Ratio of 2.0 might look fantastic on paper, but if the industry average is 4.0, the company is actually a laggard. Context is everything. Always compare a ratio to the company’s own history and to its direct competitors.
To help keep these straight, here's a quick-reference table summarizing the essentials.
Essential Financial Ratios: A Comparison
| Ratio Category | Key Ratio | Formula | What It Measures | Example Comparison |
|---|---|---|---|---|
| Liquidity | Current Ratio | Current Assets / Current Liabilities | Ability to meet short-term obligations. | A software company (few assets) vs. a retailer (high inventory). |
| Profitability | Net Profit Margin | Net Income / Revenue | Overall profitability after all expenses. | A luxury brand (high margin) vs. a grocery store (low margin). |
| Leverage | Debt-to-Equity Ratio | Total Liabilities / Shareholder's Equity | Reliance on debt to finance assets. | A utility company (stable, high debt) vs. a tech startup (low debt). |
| Efficiency | Asset Turnover | Revenue / Total Assets | How effectively assets generate sales. | A supermarket (high turnover) vs. an airline (low turnover). |
Once you get comfortable with these ratios, you're no longer just reading financial statements—you're interrogating them. They are the tools you use to diagnose a company’s health, question management's story, and ultimately build a solid, evidence-based case for an investment.
A Real-World Financial Analysis Walkthrough
Knowing the formulas is one thing, but putting them to work on a real company is where you truly start to understand the story behind the numbers. Let's walk through a brief analysis of The Home Depot (HD) vs. its competitor, Lowe's (LOW), using their 2022 fiscal year data.
Every analysis starts with the source documents. For any public company in the U.S., your go-to is the 10-K annual report. You can usually find this on the company’s investor relations website or by searching the SEC's EDGAR database. This report is your ground truth.
Setting the Scene with Vertical Analysis
Let's look at a key profitability metric using vertical analysis: the Net Profit Margin.
- Home Depot (2022): Net Income of $17.1B / Revenue of $157.4B = 10.9%
- Lowe's (2022): Net Income of $8.4B / Revenue of $97.1B = 8.7%
Immediate Insight: For every $100 in sales, Home Depot kept $10.90 as pure profit, while Lowe's kept $8.70. This tells us Home Depot is more efficient at converting sales into profit.
Digging Deeper with Key Ratios
Now it’s time to use ratios to compare their operational efficiency and financial structure.
| Ratio | Home Depot (2022) | Lowe's (2022) | Industry (Specialty Retail) | Interpretation |
|---|---|---|---|---|
| Net Profit Margin | 10.9% | 8.7% | Approx. 5-7% | Both companies are highly profitable and outperform the industry average, but HD has a clear edge. |
| Current Ratio | 1.1 | 1.0 | Approx. 1.2 | Both are operating with tight liquidity, slightly below the industry norm. Neither has a strong safety cushion. |
| Debt-to-Equity | -115.7 | -20.9 | Varies widely | Both have negative equity due to aggressive share buybacks, a common retail tactic. This ratio is distorted and requires deeper analysis of their debt structure. |
That negative Debt-to-Equity ratio is something you can't take at face value. It's caused by both companies spending more on buying back their own stock than they generated in profit, which reduces Shareholder's Equity (the denominator) below zero. To understand their actual risk, you'd need to look at the Interest Coverage Ratio to see if they can easily pay their loan interest.
Connecting the Dots and Building a Narrative
Okay, let's piece this all together.
Both Home Depot and Lowe's are profitability leaders in their industry, but Home Depot consistently demonstrates superior efficiency, turning more of its massive revenue into bottom-line profit. Both companies use an aggressive capital strategy involving share buybacks, which complicates a simple debt analysis. An investor would need to dig into the cash flow statement to see if these buybacks are funded by operating cash or new debt.
This is the essence of financial statement analysis: moving from raw data to calculated ratios and, finally, to a clear, actionable story.
The workflow is all about transforming numbers into a narrative. This process changes depending on the company. For example, analyzing a high-growth tech company that's consistently unprofitable requires a totally different mindset. To see what that looks like in the real world, check out our deep dive into Tesla's stock and financial profile.
Key Takeaway: Your goal isn't just to calculate a bunch of ratios. It's to understand the story they tell when you put them together. Always be asking "why." Why are margins shrinking? Why did debt suddenly increase? Answering those questions is how you build a solid investment thesis.
By taking this methodical approach, you can get past the surface-level numbers and really develop a nuanced picture of a company's financial health. This is how you move from just knowing the definitions to making truly informed decisions.
Identifying Red Flags and Common Analytical Pitfalls

Any seasoned analyst will tell you that the numbers themselves rarely tell the full story. The real skill is learning to read between the lines, transforming a simple review into a sharp, insightful investigation.
This is where you spot the warning signs—the financial red flags—hinting that a company's health isn't as solid as it seems. It also means you have to be disciplined enough to avoid the common analytical traps that can lead to disastrous conclusions.
Spotting Financial Statement Red Flags
Certain patterns in financial statements should make you sit up and take notice. Think of them less as definitive proof of failure and more as signals that you need to start asking much tougher questions.
Here are a few classic red flags I always watch for:
-
Profits Without Cash Flow: This is a big one. A company might post a beautiful profit on its income statement, but the cash flow statement shows it's actually bleeding cash from operations. This often means they're booking sales they haven't been paid for yet (rising accounts receivable), which is a huge risk.
-
Aggressive Revenue Recognition: If you see a company consistently booking a huge chunk of its revenue right at the end of a quarter, be suspicious. They might be "channel stuffing" (pushing excess inventory to distributors) or using complex accounting tricks to hit their targets.
-
Inventory Growing Faster Than Sales: Is inventory piling up in the warehouse much faster than revenue is coming in the door? This can be a canary in the coal mine, signaling that customer demand is weakening. It often ends with the company having to write down inventory or sell it off at a steep discount, hammering future profits.
-
A Sudden Surge in Debt: A rapid jump in liabilities, especially when it isn't linked to a clear strategic investment like a new factory, is a major concern. It could mean the company is borrowing just to keep the lights on and pay the bills, a strategy that is simply not sustainable.
Common Mistakes and Pitfalls to Avoid
Beyond just finding issues in a company's reports, it's just as important to sidestep errors in your own analysis. I’ve seen plenty of investors, even experienced ones, fall into the same traps over and over.
One of the most common blunders is making decisions based on a single ratio. A company could have a fantastic net profit margin, but if its debt-to-equity ratio is through the roof, that profit is built on a very shaky foundation.
My Personal Rule: Never fall in love with one number. Always look for confirmation from other ratios and across all three financial statements. The real insight comes from seeing how everything connects to form a complete picture of the company's health.
Another frequent mistake is comparing companies in different industries. You can't benchmark a high-growth tech company against a stable utility provider; their financial structures and business models are worlds apart. It's a completely meaningless exercise that will only lead you astray.
Finally, ignoring the footnotes is a classic rookie mistake. This is where the company discloses all the crucial details—their accounting methods, the specifics of their debt, and potential bombshells like pending lawsuits. The real story is often buried right there in the fine print. Learning to avoid these common financial mistakes that cost you millions over time is fundamental to becoming a successful investor.
Frequently Asked Questions (FAQ)
1. Which financial statement is the most important?
Many experienced investors consider the Cash Flow Statement the most important. While the Income Statement can be influenced by accounting estimates, the Cash Flow Statement tracks actual cash moving through the business, offering a reality check on a company's health. Profit is an opinion; cash is a fact.
2. How many years of financial data should I analyze?
To spot meaningful trends and avoid being misled by a single good or bad year, you should analyze a minimum of three to five years of financial data. This longer view shows how a company performs through different economic cycles.
3. Can I compare financial ratios across different industries?
No, this is a common and critical mistake. A "good" debt level for a utility company is very different from that of a software company. Ratios are only meaningful when compared to a company's own historical performance and to its direct competitors within the same industry.
4. What is the difference between liquidity and solvency?
- Liquidity refers to short-term health: a company's ability to pay its bills due within the next year (e.g., Current Ratio).
- Solvency refers to long-term health: a company's ability to meet its long-term obligations and stay in business indefinitely (e.g., Debt-to-Equity Ratio).
5. Where can I find a company's financial statements?
For publicly traded U.S. companies, the official source is the SEC's EDGAR database, which contains their 10-K (annual) and 10-Q (quarterly) reports. Most companies also provide these documents in the "Investor Relations" section of their websites.
6. What is working capital and why does it matter?
Working capital is calculated as Current Assets – Current Liabilities. It represents the resources available for day-to-day operations. Positive working capital indicates a company can cover its short-term liabilities, while consistently negative working capital can be a sign of financial distress.
7. Should I really read the footnotes in financial reports?
Absolutely. The footnotes provide crucial context and details not found in the main statements, such as accounting policies, debt covenants, and information about pending lawsuits. Ignoring them means you are only getting part of the story.
8. What does EBITDA mean?
EBITDA stands for Earnings Before Interest, Taxes, Depreciation, and Amortization. It's a metric used to assess a company's core operating profitability without the distortions of accounting decisions, financing costs, or tax jurisdiction. It's useful for comparing the operational performance of different companies.
9. How can I tell if a company is using its assets efficiently?
Use efficiency ratios like the Asset Turnover Ratio (Revenue / Total Assets). This shows how much revenue a company generates for every dollar of assets it owns. A higher ratio generally indicates better efficiency. You can also analyze Inventory Turnover to see how quickly it sells its products.
10. Is high debt always a bad thing?
Not necessarily. Debt can be a powerful tool for growth (leverage). The key is whether the company can manage it. Analyze the Debt-to-Equity Ratio for overall debt levels and the Interest Coverage Ratio to ensure earnings can easily cover interest payments.
This article is for educational purposes only and is not financial or investment advice. Consult a professional before making financial decisions.