
The real difference between QQQ and SPY boils down to a single question: Are you betting on the innovators or the entire U.S. economy? QQQ offers a concentrated shot of high-growth, tech-heavy companies, while SPY gives you a broad, diversified slice of America's biggest players. Choosing the right one hinges on whether you're chasing aggressive growth or seeking stable, market-wide representation.
In This Guide
- 1 Choosing Between QQQ and SPY for Your Portfolio
- 2 Analyzing Historical Performance and Volatility
- 3 How QQQ and SPY Perform in Different Market Cycles
- 4 Putting QQQ and SPY to Work in Your Portfolio
- 5 QQQ vs. SPY: Your Top 10 Questions Answered
- 5.1 1. Which ETF Is Better for Beginners, QQQ or SPY?
- 5.2 2. Can I Own Both QQQ and SPY in My Portfolio?
- 5.3 3. Is QQQ Riskier Than SPY?
- 5.4 4. How Do the Expense Ratios of QQQ and SPY Compare?
- 5.5 5. Which ETF Pays a Higher Dividend, QQQ or SPY?
- 5.6 6. What Is the Main Difference in Their Makeup?
- 5.7 7. How Do QQQ and SPY Perform During a Recession?
- 5.8 8. Are There Other ETFs Similar to QQQ and SPY?
- 5.9 9. Which ETF Is Better for Long-Term Growth?
- 5.10 10. Does QQQ's Exclusion of Financial Stocks Really Matter?
Choosing Between QQQ and SPY for Your Portfolio
For many investors, picking between the Invesco QQQ Trust (QQQ) and the SPDR S&P 500 ETF Trust (SPY) is a defining moment in building a portfolio. These are two absolute titans among exchange-traded funds (ETFs), but they operate on completely different philosophies. Both are classic examples of what index funds are, yet their construction leads to vastly different outcomes.
QQQ’s mission is to track the Nasdaq-100 index. This means it holds the 100 largest non-financial companies listed on the Nasdaq exchange, creating a portfolio packed with names from the technology, consumer discretionary, and communication services sectors.
SPY, on the other hand, mirrors the iconic S&P 500 index. Its portfolio contains 500 of the largest U.S. companies from all 11 major economic sectors. The S&P 500 is often seen as the primary barometer for the health of the entire U.S. stock market.
Core Strategic Differences
The main distinction here is one of focus versus breadth.
- QQQ is a targeted bet on innovation. You’re getting heavy exposure to the companies driving technological change—think Apple, Microsoft, and NVIDIA.
- SPY is a diversified bet on the U.S. economy. It's a balanced snapshot that includes entire sectors QQQ completely leaves out, such as financials, energy, and materials.
This fundamental structural difference creates a ripple effect, influencing everything from performance and risk to how you’d use each ETF in your strategy.
There's no single "better" ETF. The right answer is deeply personal and depends entirely on your financial goals, how much risk you can stomach, and your investment timeline. Let's break down the nuances to help you make an informed choice.
First, let's get a high-level view of their key attributes.
Quick Comparison QQQ vs SPY at a Glance
This table offers a side-by-side snapshot of the core differences between these two powerhouse ETFs. It's a great starting point for understanding how their underlying strategies diverge.
| Metric | Invesco QQQ Trust (QQQ) | SPDR S&P 500 ETF Trust (SPY) |
|---|---|---|
| Index Tracked | Nasdaq-100 | S&P 500 |
| Number of Holdings | Approximately 100 | Approximately 500 |
| Sector Focus | Tech, Communications, Consumer Discretionary | Diversified across all 11 sectors |
| Key Exclusions | All financial companies | None (based on index criteria) |
| Volatility Profile | Higher | Lower (relative to QQQ) |
| Growth Potential | Higher | Moderate (broad market growth) |
| Expense Ratio | ~0.20% | ~0.09% |
As you can see, QQQ is a more concentrated, tech-forward fund with higher fees and volatility, while SPY offers broader, more stable exposure to the U.S. market at a lower cost. These distinctions will become crucial as we dive deeper into their performance and portfolio roles.
Before you can really compare QQQ and SPY, you have to get to know the engines that drive them: the Nasdaq-100 and the S&P 500 indexes. An ETF is, after all, just a vehicle. Its destination is determined entirely by the index it tracks, and these two are on fundamentally different journeys.
The S&P 500: The Classic U.S. Market Snapshot
The SPDR S&P 500 ETF Trust (SPY) is built on the S&P 500, which is probably the most famous stock market benchmark on the planet. Its goal is simple but powerful: to represent the overall health and performance of the U.S. stock market.
Think of it as a carefully constructed portfolio, not just a list of the biggest companies. The S&P Index Committee hand-picks these firms to create a balanced view of the American economy.
- Who Gets In? Companies need to be stable, profitable, and easy to trade. They must have a history of positive earnings and meet certain size requirements.
- Broad Exposure: The index pulls from all 11 GICS (Global Industry Classification Standard) sectors. This gives you a piece of everything—from tech and healthcare to banks and energy companies.
- An Economic Bellwether: Because it’s so diversified, the S&P 500’s ups and downs are often seen as a direct pulse on the U.S. economy.
So, while you get plenty of exposure to the big tech names in SPY, their weight is counterbalanced by industrial powerhouses, banking giants, and healthcare leaders.
The Nasdaq-100: A Bet on Innovation
The Invesco QQQ Trust (QQQ) takes a completely different route by tracking the Nasdaq-100. This index isn't trying to be the whole market; it's a laser-focused collection of innovators.
The rule is straightforward: it includes the 100 largest non-financial companies listed on the Nasdaq exchange. That one little detail—excluding financials—changes everything. It leaves you with a portfolio stacked with technology, consumer, and communication giants. For a look at how many of these names dominate the market, check out this guide on the biggest stocks by market cap.
QQQ isn’t an investment in the entire U.S. economy. It's a concentrated bet on the companies driving the future of tech, biotech, and new-age consumerism. The absence of banks is a core part of its DNA.
This sharp focus becomes crystal clear when you look at how the two ETFs are actually built.
Sector Weighting and Top Holdings Breakdown
The real story of QQQ vs. SPY is told in their composition. This table lays bare just how differently they are constructed, which is the primary reason their performance can diverge so dramatically over time.
| Attribute | QQQ (Nasdaq-100) | SPY (S&P 500) |
|---|---|---|
| Top Sector | Information Technology (~50%+) | Information Technology (~30%) |
| Second Sector | Communication Services (~15%) | Financials (~13%) |
| Financial Sector | 0% (Excluded by rule) | ~13% (Major component) |
| Top 5 Holdings | Microsoft, Apple, NVIDIA, Amazon, Meta | Microsoft, Apple, NVIDIA, Amazon, Alphabet |
| Weight of Top 10 | Over 45% | Around 33% |
As you can see, the top holdings might look similar at first glance, but their concentration in QQQ is on another level. With its top ten holdings making up over 45% of the fund, the performance of a few mega-cap tech stocks has a massive impact on QQQ's daily price swings.
This structure gives QQQ a higher-risk, higher-potential-reward profile. SPY, on the other hand, is more balanced and tends to be a smoother ride. Interestingly, despite their very different personalities, they both have a Sharpe ratio of 0.98, which suggests they've delivered similar returns for the amount of risk taken.
However, for a long-term buy-and-hold investor, fees matter. SPY comes in at a lean 0.09% expense ratio, while QQQ is more than double that at 0.20%. That's a critical difference that compounds over decades.
Analyzing Historical Performance and Volatility
While past results are no crystal ball, digging into historical data gives us a powerful lens to see the true character of QQQ and SPY. This isn't about chasing last year's hot performer. It's about understanding how each fund reacts in the real world—how they handle bull markets, bear markets, and everything in between. This context is absolutely critical for matching an ETF to your own stomach for risk.
When you put QQQ and SPY side-by-side, the fundamental tradeoff becomes immediately clear: aggressive growth potential comes at the cost of higher risk. QQQ's heavy bet on technology and growth-focused innovators has been a rocket ship for returns, but it's a much bumpier ride.
The Growth vs. Stability Tradeoff
The numbers don't lie. Over the last decade, QQQ has steamrolled SPY, delivering an impressive annualized return of 18.60%. SPY, in contrast, posted a solid but more modest 13.70% over the same 10-year stretch.
But that outperformance comes with a very real price tag: volatility. QQQ typically has a beta of around 1.3x relative to SPY. In plain English, that means it tends to be about 30% more volatile than the broader market. When the market zigs, QQQ zigs harder.
Even more telling is the maximum drawdown—the worst peak-to-trough loss each fund has ever experienced. For QQQ, that number is a staggering -82.98%. SPY's worst drop was -55.19%. This shows that while QQQ investors have been rewarded handsomely, they've also had to endure far deeper and more painful losses during downturns. To get a better handle on this, it's worth understanding what market volatility is and how it can affect your portfolio's journey.
The core dynamic is simple: QQQ is a high-octane engine that delivers incredible speed, but it also slams on the brakes much harder.
This chart drives home the key reason for this difference: the massive gap in technology weighting.
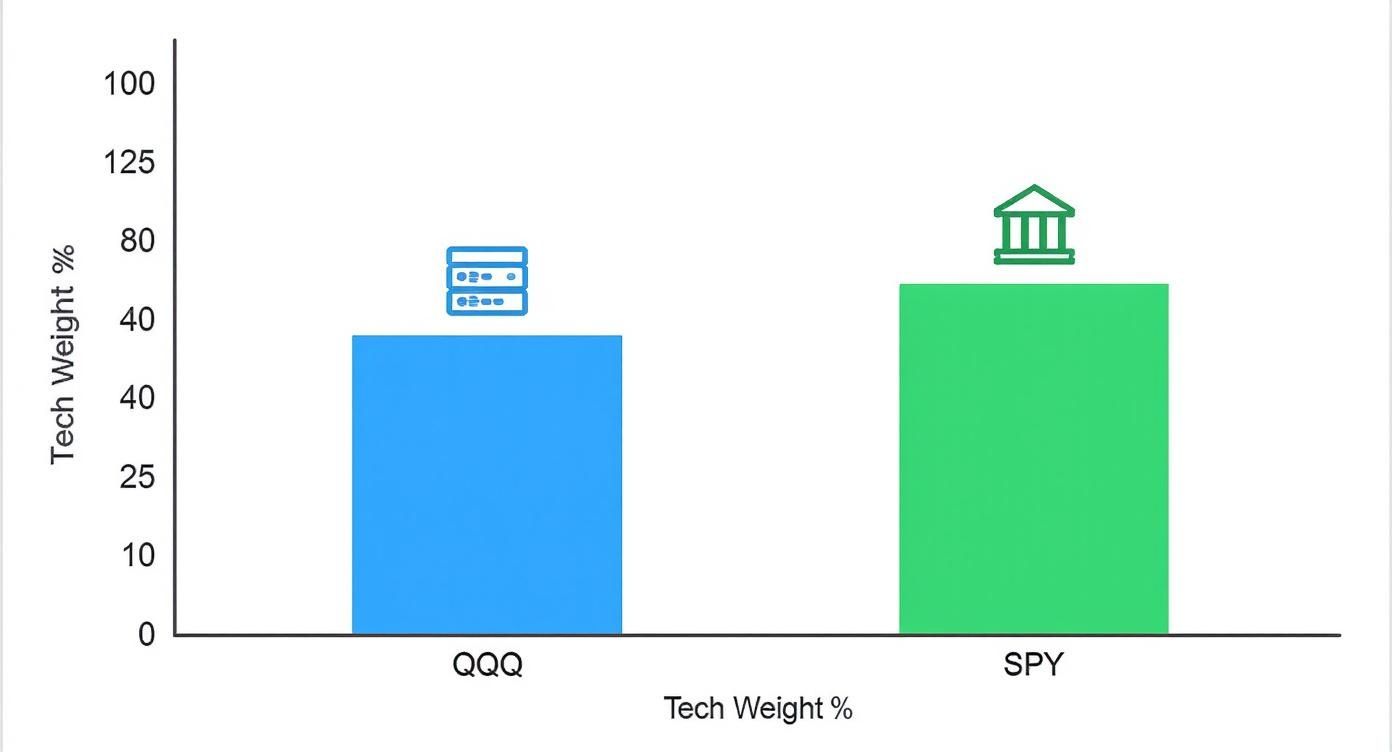
As you can see, QQQ is utterly dominated by tech. While tech is also the largest piece of SPY's pie, it's balanced out by a healthy mix of many other sectors.
A Tale of Two Decades
To see this play out in the real world, just look at two very different chapters in market history.
- The Dot-Com Bubble (2000-2002): This period was an absolute catastrophe for QQQ. As the tech bubble imploded, the fund plummeted, shedding over 80% of its value. SPY got hit hard too, but its diversification into boring-but-stable sectors like healthcare and consumer staples acted as a shock absorber. The loss was painful, but nowhere near as devastating.
- The Post-2008 Recovery (2009-2020): After the Global Financial Crisis, the script flipped. Technology and innovation took the driver's seat. In this environment, QQQ was king, consistently blowing past the broader market as titans like Apple, Amazon, and Google fueled one of the longest bull runs ever. SPY did well, of course, but it simply couldn't keep pace with the Nasdaq-100's explosive growth.
These two eras are the perfect reminder of how quickly market leadership can change. QQQ's fate is welded to the tech sector, for better or for worse. SPY’s broad diversification means it will rarely capture the most spectacular gains, but it's also built to avoid the most gut-wrenching losses.
Quantifying the Risk with Key Metrics
Let’s put some hard numbers to these observations to really nail down the risk profiles.
- Beta: As we covered, QQQ's beta hovers around 1.2 to 1.3. For every 10% move in the S&P 500, expect QQQ to move 12% to 13% in the same direction. SPY’s beta is, by definition, 1.0.
- Maximum Drawdown: That -82.98% drop for QQQ during the dot-com bust isn't just a statistic; it's a stark warning of its potential downside.
- Standard Deviation: This metric measures how widely an asset's returns are scattered. QQQ consistently has a higher standard deviation, confirming its price action is far more erratic than SPY's.
Ultimately, choosing between them comes down to your personal risk equation. Can you stomach the deep valleys for a chance to climb higher mountains? Or do you prefer a steadier, more predictable journey that mirrors the broad U.S. economy? Your answer will point you toward either the specialist (QQQ) or the generalist (SPY).
How QQQ and SPY Perform in Different Market Cycles
You can't really judge an ETF when the market is calm and climbing. Its true colors show when things get turbulent. Looking at how QQQ and SPY behave in different market cycles makes one thing crystal clear: neither is better all the time. Their strengths and weaknesses are completely situational.
Understanding this dynamic is the key to making a smart, strategic choice instead of just piling into last year's winner. The back-and-forth performance between these two is a lesson in economic ebb and flow, and a stark reminder of the dangers of recency bias—assuming what just happened will keep happening.

A Tale of Two Decades: A Lesson in Cyclical Performance
If you want a masterclass in market rotation, just look at how QQQ and SPY performed from 2000 to 2020. It’s a fascinating story that completely demolishes the idea of chasing past returns.
The first decade, 2000-2009, was brutal. The dot-com bust and the 2008 financial crisis hammered both funds. But while SPY managed to limp away with a manageable loss of around 10%, QQQ was absolutely devastated, dropping by roughly 50%.
Then the script flipped. From 2010 to 2020, tech stocks went on an unbelievable tear, and QQQ left SPY in the dust. This dramatic reversal, which you can see detailed over at OptimizedPortfolio.com, shows why you have to think about market cycles and valuations, not just past performance.
Bull Markets: The Growth Engine Roars
When the economy is humming and stocks are climbing, QQQ often shines. Its heavy dose of tech and consumer discretionary stocks—the very sectors that pop during periods of innovation and strong consumer spending—acts like rocket fuel.
- Low-Interest Rate Environments: Cheap money allows growth companies to invest aggressively in their future, which in turn boosts their stock prices and powers QQQ.
- Technological Breakthroughs: Think of the dawn of the internet or the current AI boom. These massive shifts disproportionately benefit the innovators packed into the Nasdaq-100.
SPY does just fine in these bull runs, of course. But its exposure to slower-moving, defensive sectors like utilities and consumer staples often means it lags behind the more aggressive, high-octane QQQ.
Bear Markets and Recessions: The Flight to Safety
When the economy stumbles and fear takes hold, the dynamic completely reverses. This is where SPY’s diversification becomes its most valuable feature.
In a downturn, investors don't want exciting growth stories; they want safety and stability. The S&P 500's broad mix, which includes sturdy sectors like healthcare, consumer staples, and financials, provides a shock absorber that the tech-heavy QQQ simply doesn't have. QQQ's high-flying growth stocks, often trading at lofty valuations, are usually the first to get dumped when panic sets in.
This built-in defensiveness is why SPY has historically seen smaller losses during market crashes. For investors whose priority is protecting their capital, SPY is the go-to choice when economic storm clouds are gathering. If you want to get a better handle on these shifts, our guide to understanding stock market cycles for better investing is a great place to start.
Factors Influencing Relative Performance
It's not just about simple bull and bear markets. Other economic conditions can tilt the scales in favor of one ETF or the other.
| Economic Factor | Favorable for QQQ | Favorable for SPY |
|---|---|---|
| Interest Rates | Falling or low rates | Rising or high rates |
| Inflation | Moderate and stable | Can be resilient in moderate inflation |
| Economic Growth | Accelerating growth | Slow, steady, or contracting growth |
| Market Sentiment | "Risk-on" (appetite for growth) | "Risk-off" (flight to quality) |
Ultimately, the choice between QQQ and SPY depends on your view of the future. Are we heading into a period of rapid innovation and economic expansion? Or are there headwinds on the horizon that call for a more cautious approach? Answering that question is the first step to aligning your portfolio with the market's next move.
Putting QQQ and SPY to Work in Your Portfolio
Knowing the nuts and bolts of QQQ and SPY is one thing, but figuring out how to actually use them to build a portfolio that fits your life is where the real work begins. The best choice always comes down to your personal situation—your age, how comfortable you are with risk, and what you’re trying to achieve with your money.
Let's get practical and explore how these ETFs fit into real-world investment plans.

The decision isn't just about chasing the fund with the best recent returns. It’s about building a portfolio that’s tailor-made for your journey.
For the Young Investor with a Long Time Horizon
If you're in your 20s or 30s, your greatest advantage isn't stock-picking prowess; it's time. With decades to go before retirement, you can afford to stomach more volatility in exchange for a shot at much higher long-term returns.
Real-Life Example: Meet Sarah, a 28-year-old software engineer. Her goal is aggressive growth over the next 35 years. She can tolerate market downturns knowing she has decades to recover.
- Her Strategy: Sarah allocates 70% of her stock portfolio to QQQ to maximize exposure to the tech innovation she understands from her own industry. The remaining 30% goes into SPY for a stable, diversified foundation.
- The Rationale: This high-growth tilt aligns with her long time horizon. The significant QQQ position acts as a powerful growth engine, while the SPY allocation provides a buffer and prevents her from being 100% dependent on the tech sector.
For the Investor Nearing Retirement
Someone in their late 50s or 60s is playing a completely different game. The focus flips from aggressively growing a nest egg to protecting it and making it last. Stability and income generation become the top priorities.
Real-Life Example: Consider David, a 62-year-old nearing retirement. His primary goal is capital preservation and generating supplemental income. He cannot afford a significant portfolio drop like the dot-com crash.
- His Strategy: David allocates 60% of his stock portfolio to SPY. This forms a stable core that mirrors the U.S. economy. He puts only 10% into QQQ for a small dose of growth potential. The remaining 30% of his portfolio is in high-quality bond ETFs for income and stability.
- The Rationale: SPY's broad diversification and lower volatility are crucial for protecting David's capital. The small, tactical QQQ position allows him to participate in some tech upside without exposing his retirement funds to excessive risk.
The Core-Satellite Strategy: A Balanced Approach
For many people, the answer isn't choosing one over the other. A far more nuanced approach is to use both, which is exactly what the core-satellite strategy is designed for. This popular method blends the unique strengths of both ETFs into one balanced, customized portfolio.
The idea is simple: build a large, stable foundation (the "core") with a broadly diversified fund, then add smaller, more targeted investments (the "satellites") to chase specific goals, like higher growth.
This strategy lets you dial in the exact risk level you're comfortable with.
Here’s How It Works:
- The Core (70-80% of Portfolio): SPY makes a perfect core holding. It gives you low-cost, diversified exposure to the entire U.S. market, acting as the bedrock of your investment plan.
- The Satellites (20-30% of Portfolio): QQQ is an ideal satellite. This smaller allocation gives your portfolio a "growth tilt," letting you tap into the Nasdaq-100's innovation without betting the farm on the tech sector.
An investor using this method gets the best of both worlds: the bedrock stability of the S&P 500 combined with a targeted dose of growth potential from the Nasdaq-100. This approach does require a bit of maintenance; for more on keeping your allocations in check, check out our guide on portfolio rebalancing strategies.
Ultimately, deciding how to use QQQ or SPY is a strategic move. Whether you pick one, the other, or a combination, the goal is to make sure your choice directly supports where you want to go financially.
QQQ vs. SPY: Your Top 10 Questions Answered
Diving into ETFs always brings up good questions. To help you sort through the QQQ vs. SPY decision, I’ve put together answers to the ten most common questions I hear from investors. Think of this as a final check to solidify your understanding before putting your money to work.
1. Which ETF Is Better for Beginners, QQQ or SPY?
For anyone just getting their feet wet in the market, SPY is almost always the better starting point. It tracks the S&P 500, which means you instantly own a small piece of 500 of America's largest and most established companies.
This broad exposure across every major economic sector helps cushion your portfolio from the ups and downs of any single industry. SPY works beautifully as a core holding because it's essentially a bet on the entire U.S. economy. Its lower volatility provides a much smoother ride, which is critical for building good habits and staying invested for the long haul.
QQQ, on the other hand, is more of a high-octane, specialized tool. Its heavy bet on technology and its wilder price swings make it a better fit for someone who already has a solid portfolio foundation and is comfortable with more risk.
2. Can I Own Both QQQ and SPY in My Portfolio?
Absolutely. In fact, holding both is a smart and very common strategy. The classic way to do it is with a ‘core-satellite’ approach.
Think of it this way: SPY is your large, stable 'core.' It’s the bedrock of your portfolio, giving you that foundational exposure to the entire U.S. market.
Then, you add QQQ as a smaller 'satellite' holding. This move gives your portfolio a "growth tilt," deliberately overweighting the innovative, high-growth companies in the Nasdaq-100. The blend gives you a nice balance of stability and targeted growth potential.
Just be mindful of the overlap. Since both ETFs are loaded with tech giants like Apple, Microsoft, and Amazon, combining them will double down your exposure to these specific names.
3. Is QQQ Riskier Than SPY?
Yes, without a doubt. QQQ is significantly riskier than SPY, and that risk comes from two main places:
- Sector Concentration: With over 50% of its assets packed into the Information Technology sector, QQQ’s fate is tied directly to the health of that one industry. If tech stumbles, QQQ is going to feel the pain far more than the broadly diversified SPY.
- Higher Volatility: QQQ has a higher beta (usually around 1.2–1.3), which means its price movements are more dramatic than the overall market. In plain English, when the market goes up, it tends to go up more, but when the market drops, it drops harder. It lost over 80% of its value during the dot-com bust—a brutal reminder of its risk profile.
That extra risk, of course, is the price you pay for the potential of higher returns.
4. How Do the Expense Ratios of QQQ and SPY Compare?
When it comes to cost, SPY has a clear edge. Its expense ratio is a lean 0.09%, whereas QQQ’s is more than double that at 0.20%.
That difference of 0.11% might sound like pocket change, but over decades of compounding, it can cost you thousands. For any long-term investor, keeping fees low is one of the easiest ways to boost your net returns. On this front, SPY is the hands-down winner.
5. Which ETF Pays a Higher Dividend, QQQ or SPY?
SPY consistently pays a higher dividend yield. This isn't a fluke; it's baked into the DNA of the companies it holds. The S&P 500 is full of mature, established businesses in sectors like financials, utilities, and consumer staples that have a long history of sharing profits with investors.
The Nasdaq-100, by contrast, is packed with growth-oriented companies. These firms would rather plow every dollar of profit back into research and development to fuel more growth, not send it out as a dividend check.
6. What Is the Main Difference in Their Makeup?
The core difference is the index each one follows. SPY mirrors the S&P 500, which is a carefully selected portfolio of 500 large U.S. stocks across all 11 official economic sectors. A committee picks these companies to be a true representation of the U.S. economy, so you get heavy exposure to everything from healthcare to banking.
QQQ follows the Nasdaq-100, which is simply the 100 largest non-financial companies listed on the Nasdaq exchange. That rule—the exclusion of financial companies—is the key. It’s why the fund is so heavily tilted toward technology and communication services and has zero exposure to big banks.
7. How Do QQQ and SPY Perform During a Recession?
History shows that SPY holds up much better during recessions. Because it’s diversified across defensive sectors, it has a built-in buffer. People still buy groceries (consumer staples), go to the doctor (healthcare), and keep the lights on (utilities) even when the economy is struggling.
QQQ, with its focus on high-growth tech, tends to get hit much harder. When a recession looms, investors get nervous and dump their riskier, high-valuation growth stocks in a flight to safety.
8. Are There Other ETFs Similar to QQQ and SPY?
Yes, and you should absolutely know about them. Both have popular, lower-cost clones that track the exact same indexes.
- S&P 500 Alternatives: Check out the iShares Core S&P 500 ETF (IVV) and the Vanguard S&P 500 ETF (VOO). Both offer expense ratios around 0.03%, making them even cheaper ways to own the S&P 500.
- Nasdaq-100 Alternative: Look at the Invesco NASDAQ 100 ETF (QQQM). It’s often called the "Q mini" because it tracks the same index as QQQ but with a lower fee (0.15%) and a smaller share price, making it great for dollar-cost averaging.
9. Which ETF Is Better for Long-Term Growth?
This is the big question, isn't it? If we look strictly at the past 15 years, QQQ has delivered much higher growth. That incredible run was powered by the historic bull market in technology.
But "better" really comes down to your stomach for volatility. QQQ's path was a wild one. If you're an investor who believes tech will continue to lead the way and you can handle the sharp drops, QQQ is a powerful engine for growth. If you prefer steady, diversified growth that mirrors the U.S. economy as a whole, SPY is a timeless choice.
10. Does QQQ's Exclusion of Financial Stocks Really Matter?
It matters a great deal. Having 0% exposure to the financial sector is one of QQQ's most defining—and consequential—features. It means you completely miss out on the performance of big banks, insurance companies, and asset managers.
This can be a huge drag when financials are outperforming, like in a rising interest rate environment. But it was a massive benefit during the 2008 Financial Crisis, as QQQ was shielded from the banking sector's collapse. This single rule is a major reason why QQQ's performance can look so different from the S&P 500's.
Ready to take the next step in your investment journey? At Top Wealth Guide, we provide the insights and strategies you need to build lasting wealth. Explore our resources and start making more informed financial decisions today at https://topwealthguide.com.
This article is for educational purposes only and is not financial or investment advice. Consult a professional before making financial decisions.