
Wall Street pros—they’re like wizards of finance, shrouded in secrecy, guarding their investment research methods as if they’re top-secret recipes for some magical potion. The techniques? Oh, they’re not just fiddling around with stock screeners and crunching a few ratios. Nope, they’re light-years beyond that.
Enter: Top Wealth Guide. Here, we strip down these high-octane, professional-grade strategies to the essentials. You’ll get your hands on the same arsenal of analytical tools that the big guns—those institutional investors—wield. It’s all about spotting those winning opportunities and safeguarding their treasure chests.
In This Guide
Which Financial Metrics Actually Predict Stock Performance?
Forget the pedestrian price-to-earnings ratios-those are for the retail investors on training wheels. The real action? It’s in the advanced metrics, the ones that put hair on your chest. Return on invested capital-the gospel of savvy insiders. This metric? It’s your litmus test for management’s ability to squeeze profit from every dollar they invest. Meanwhile, free cash flow yield-think of it as the B.S. detector, separating actual cash generators from the magicians playing accounting tricks. Get this: Goldman Sachs says companies with an ROIC above 15% beat the market by 3.2% every year over a five-year stretch. That’s not small change, folks.
The Cash Flow Reality Check
Dive into the cash flow statements-where truth isn’t just told, it’s shouted. If operating cash flow doesn’t routinely outpace net income, you’re looking at inflated profits, courtesy of accounting sleight-of-hand. Wise investors keep an eagle eye on cash conversion cycles to find the firms flipping inventory to cash quicker than a pancake on a griddle. Amazon’s negative cash conversion cycle is the stuff of legends-suppliers foot the growth bill while customers pay upfront (hello, killer edge). Peek at the changes in working capital on the cash flow statement… see seasonal patterns and capital efficiency you won’t find in those polished earnings reports.
Competitive Moats That Matter
Market share numbers… more like smoke and mirrors. But competitive positioning metrics? Now we’re talking. Gross margin trends over a half-decade reveal if a company can flex pricing power muscles over rivals. Then there’s customer acquisition cost vs. lifetime value-pit bulls like that separate enduring businesses from the cash incinerators. Firms boasting an LTV-to-CAC ratio above 3:1? They’re the rulers of their realms, sticking around for the long haul. And let’s not forget patent filings, R&D spend as a slice of revenue, and employee retention-these are your crystal ball into who keeps their competitive edge when the economy hits turbulence.
Advanced Valuation Techniques
Ever gone apple-picking with enterprise value to EBITDA ratios? They strip away capital structure fog, enabling true comparisons. Price-to-book value? Throw it out for asset-light operators. Instead, lean on tangible book value per share to unearth hidden gems in capital-heavy sectors. Discounted cash flow models-oh boy, they need three biggies: growth rates, discount rates, terminal values. Where do most retail investors screw up? Right here. The pros use industry benchmarks and sensitivity analysis-stress-testing their hypotheses before putting skin in the game.
These aren’t just metrics-they’re the bedrock of elite research. This is access to the same high-octane databases and resources the big leagues digest every day.
Where Do Pros Find Their Investment Intelligence?
The SEC’s EDGAR database-think of it as the investment world’s unsung hero. It’s the place professional investors hoard their intel but, guess what? Most retail traders barely scratch past those vanilla 10-K reports. The real action? It’s in the proxy statements (DEF 14A)-folks there track exec pay shifts and who’s bailing on their own stocks.
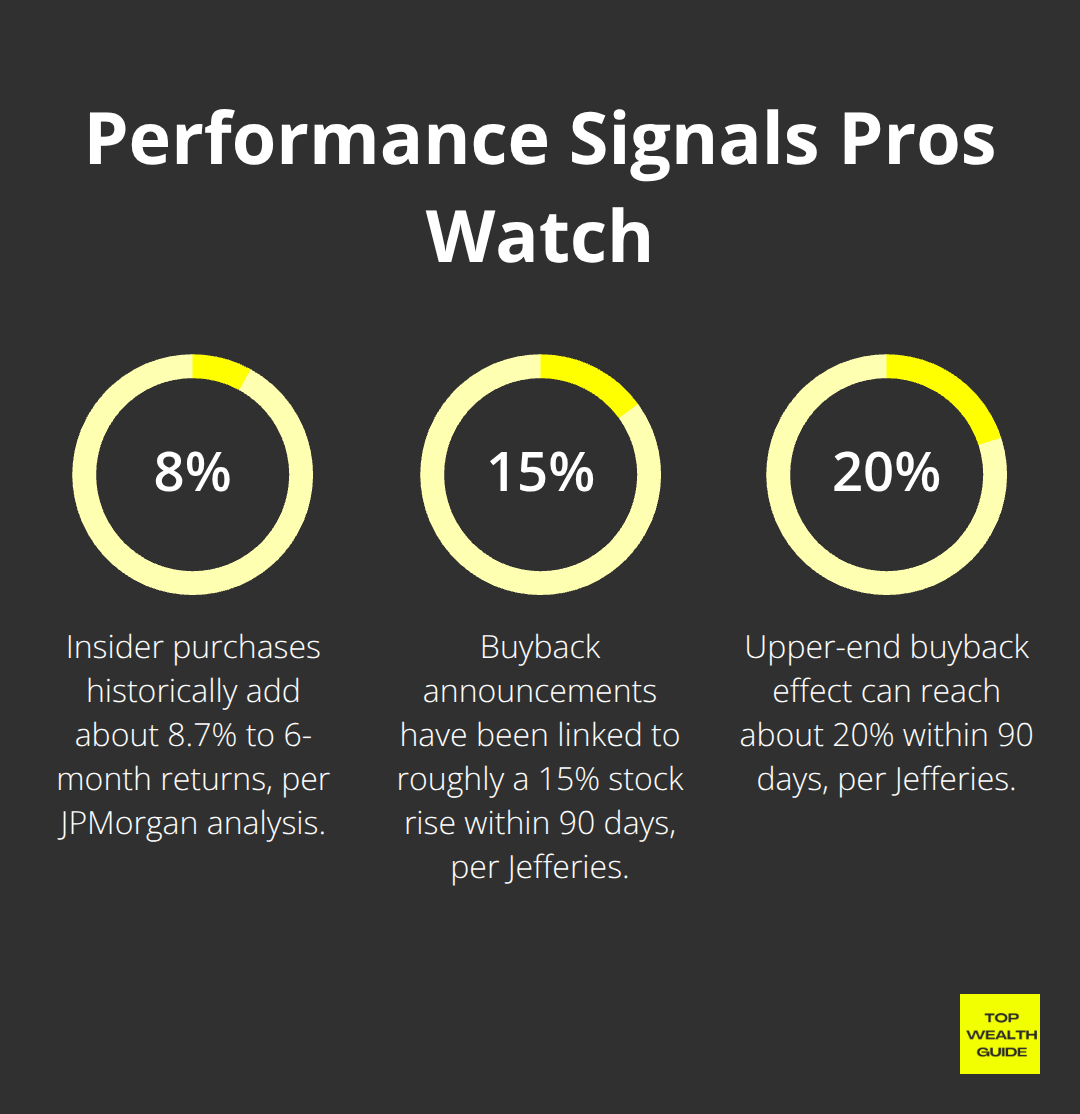
Seeing CEO pay nosedive or execs dumping shares? Yeah, time to sound the alarms. And those Form 4 reports-they spill the beans on insider trades within two days. JPMorgan’s quants crunched some numbers and boom, insider buys = 8.7% better returns over half a year.
Then you’ve got the 13F reports-no secret handshakes needed. Heavy hitters like Berkshire Hathaway and Renaissance Tech spill where they park their dough. These forms? They’re gold mines, showing us where institutional big shots with $100 mil + stow their cash each quarter. And let’s not forget Form 8-K-those material events that could shake up stock prices faster than breaking news hits your feed. Yep, these documents… that’s the real juice behind the big money moves.
Professional Database Access Without the Wall Street Price Tag
Let’s talk Bloomberg Terminal: $24,000 every year-ouch. Alternatives like FactSet and Refinitiv? Slightly gentler on the wallet but still at $12,000 annually. And if you’re feeling fancy, Morningstar Direct is yours for a cool $34,000.
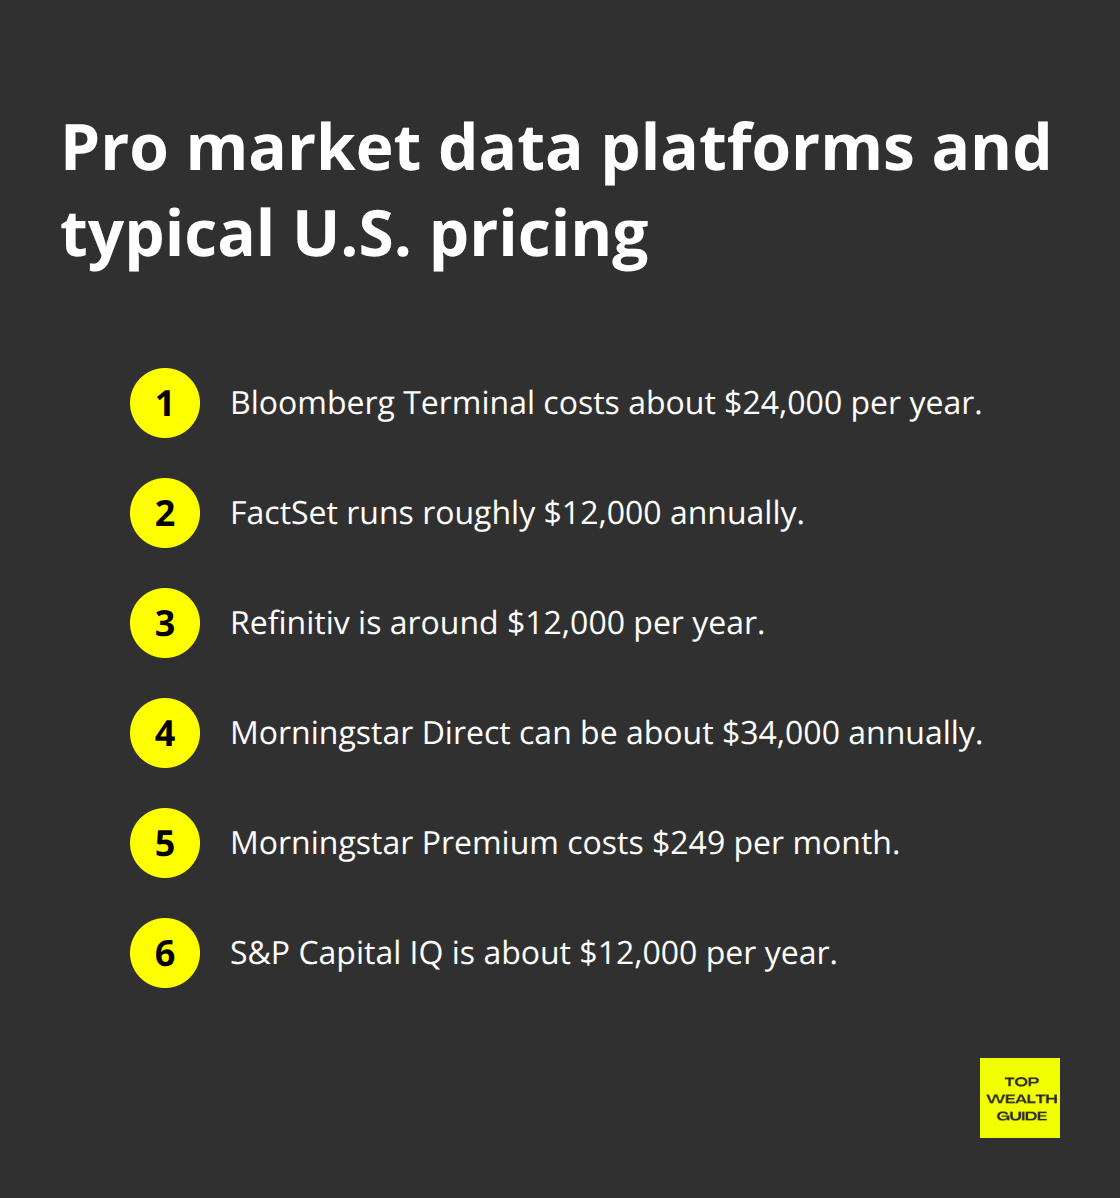
Their basic premium that gives you most essentials stands at $249 a month. S&P Capital IQ, trusted by Goldman Sachs number crunchers, is clocking in at $12,000 per annum.
But don’t fret, there are freebies-FRED Economic Data from the Fed and the unexpectedly beefy Yahoo Finance API. The biggie? Pro platforms whip up real-time dashboards-insider trades, institutional flows, earnings tweaks-the works, while retail platforms? They’re always a beat behind.
Smart Money Movement Patterns
Heads up-Form 13D reports, they’re like the sirens when someone’s snagged 5% or more of a company. This can precede major price swings weeks ahead. 13F reports from players like Tiger Global, Coatue, and Pershing Square? They reveal tasty tidbits on portfolio shifts the individual investors can, well, imitate. For those willing to shell out $97 monthly, FlowAlgo highlights unusual options activity-clues to where the institutions are throwing their money before earnings roll out.
And there’s short interest data from FINRA, reported by 6 p.m. ET on the second day after settlement-spotting when the smart folks are betting against overpriced stocks. Corporate buybacks announced in 8-K reports can mean stock values jumping 15-20% in 90 days, as shown by Jefferies’ analysis. It’s like a cheat sheet for mapping sophisticated risk evaluation, separating the pros from the rookies when drafting long-term growth strategies.
How Do Wall Street Pros Actually Manage Risk?
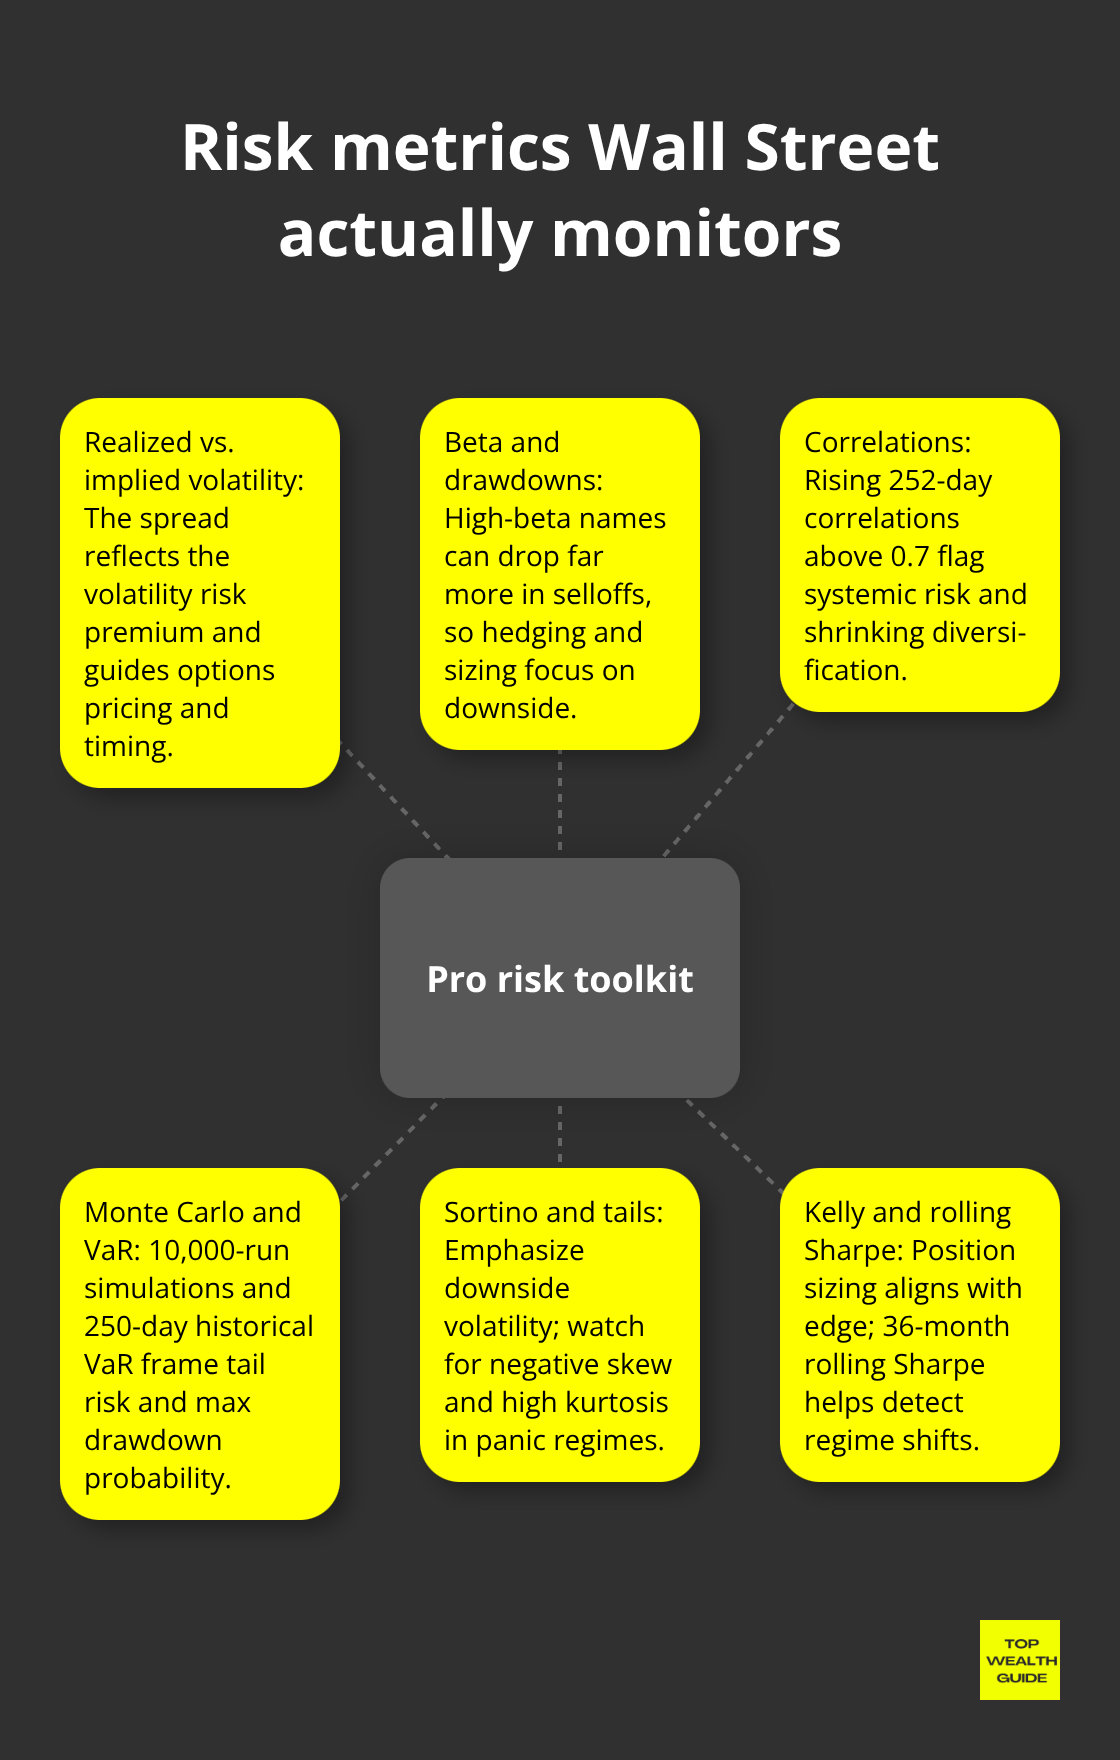
So, the VIX fear gauge… it’s like the celebrity headline, but here’s the kicker-pros dig into realized volatility versus implied volatility spreads. Implied volatility? Always juiced up more than realized, thanks to the volatility risk premium. This little nugget? Pure gold for pricing strategies. According to Goldman Sachs, stocks sporting beta over 1.5? They tank 23% harder in downturns. Ouch. The savvy crowd? They’re eyeing 252-day correlations-none of that static stuff most retail folks love. When you see normally unlinked assets-gold and tech stocks-suddenly becoming besties with a correlation over 0.7, you know systematic risk ain’t far behind.
The Real Math Behind Portfolio Diversification
Wanna talk fake diversification? Just peek at those portfolio correlation matrices. Back in the 2008 meltdown, supposedly diverse assets? They went from a casual 0.3 to a way-too-cozy 0.85 in a blink. The pros? Monte Carlo simulations, 10,000 iterations-testing portfolios against tail risk like it’s a war game. Seriously, what’s the key stat? Maximum drawdown probability-hitting that 95th percentile is the money shot. Bridgewater Associates spilled the tea: the classic 60/40 stock-bond mix? Total flop when both assets decide to tango the same way (yup, happens 34% of the time in recessions). Value at Risk? The cool kids are all about historical simulations over 250-day windows for better downside shielding than those snooze-fest parametric models.
Stress Tests That Actually Predict Market Crashes
Forget backtesting-scenario analysis is where it’s at. Picture this: run your portfolio through Black Monday 1987, the dot-com implosion, and COVID-19’s chaos all at once. If you’re losing north of 35% in a single test, buddy, you’re drowning in systematic risk. Pros? They’re all over the Sortino ratio, dumping the Sharpe-Sortino’s all about that downside focus. Got positions with negative skewness under -0.5 and kurtosis over 3.0? That’s a big-fat-tail risk flag waving “Danger!” in market panics.
Advanced Risk Metrics Professionals Actually Use
Crunch your portfolio’s max theoretical loss with extreme value theory. If it tops 50% of your net worth… well, you better rebalance yesterday. The pros? They’ve got rolling Sharpe ratios on a 36-month watchlist to catch those wrong-way winds just before the big losses hit. Kelly Criterion? It’s the secret sauce for nailing position sizes based on win rates and average returns-retail investors? Mostly oblivious, to be honest. And always, always track your portfolio’s beta stability through different market vibes-if your betas are shaky above 0.3 standard deviation, you’re looking at hidden leverage about to go nuclear during market tumbles.
Final Thoughts
Ah, investment research-the secret sauce that turbocharges your portfolio into a high-flying machine. We’re talking about the big leagues here, where metrics like ROIC above 15% are your playbook. Cash flow analysis and those competitive positioning tools? They’re the top-tier strategies on your tool belt. And let’s not forget SEC filings, insider trades, and 13F reports. These gems are the inside scoop that most retail investors-well, let’s just say they aren’t exactly tapping into them.
Risk management? It’s your safety net. We’re diving into correlation analysis, Monte Carlo simulations, and stress tests. These bad boys are your armor, protecting your capital when the market takes a nosedive. For the pros who play their cards right, this isn’t just theory-it’s measurable alpha. Start poking around in the SEC EDGAR database, keep an eagle eye on insider movements with Form 4 reports, and while you’re at it, crunch those correlation numbers on your holdings.
The chasm between the big shots and retail investors? It’s narrowing. Master these time-tested techniques, and you’re leveling the playing field. Over at Top Wealth Guide, we’re all about equipping you to swap guesswork for something much sexier-data-driven decisions. (No more flying blind when the market’s losing its mind.) Just grab one advanced metric from this guide, weave it into your research fabric this week, and watch your investment game catch fire.