
When you’re getting into real estate, it’s easy to get swept up in the look of a property or a “good feeling” about a neighborhood. But seasoned investors will tell you that the real money is made on the numbers, not on intuition. This is precisely where a real estate investment calculator comes in—it’s your secret weapon for making smart, data-backed decisions.
Think of it as a financial crystal ball for a potential property. It lets you run the numbers and see how an investment might perform before you ever sign a contract or put any money down. This guide, grounded in first-hand investment analysis, will show you how to use this tool to build a successful real estate portfolio.
In This Guide
- 1 Your Guide to Smarter Property Investing
- 2 What Goes Into a Real Estate Investment Calculator?
- 3 Understanding the Metrics That Matter
- 4 Analyzing Real-World Investment Scenarios
- 5 Choosing the Right Investment Calculator
- 6 Advanced Strategies and Common Mistakes to Avoid
- 7 Frequently Asked Questions (FAQ)
- 7.1 1. What’s the single most important metric for a beginner to watch?
- 7.2 2. How can I get realistic estimates for operating expenses?
- 7.3 3. What is a “good” Cash-on-Cash (CoC) Return?
- 7.4 4. Can a calculator predict a property’s future appreciation?
- 7.5 5. How much does the vacancy rate really affect my numbers?
- 7.6 6. What’s the main difference between Cap Rate and ROI?
- 7.7 7. Should I include management fees if I plan to self-manage?
- 7.8 8. How often should I re-analyze my existing properties?
- 7.9 9. How do I budget for Capital Expenditures (CapEx)?
- 7.10 10. Can I use a standard calculator for commercial properties like office buildings?
Your Guide to Smarter Property Investing
This guide is designed to show you exactly how to use this powerful tool. We’ll move past gut feelings and into the world of strategic, data-driven investing. When you understand the numbers behind a deal, you can confidently forecast your potential returns and make sure a property actually fits your financial goals.
The biggest step you can take toward building a successful portfolio is to stop guessing. A good calculator forces you to look at the real costs of owning a rental property, which go way beyond just the monthly mortgage payment. It gives you a clear framework for analyzing a deal from every important angle.
Why a Calculator Is Essential
A real estate investment calculator is much more than a simple spreadsheet. It’s a strategic tool that turns a messy pile of financial data into clear, easy-to-understand metrics that spell out a property’s true potential.
- Objective Analysis: It strips the emotion out of the decision-making process. The focus is purely on whether the numbers work.
- Comprehensive Cost Breakdown: It shines a light on all those easily forgotten expenses, like vacancy periods, funds for future repairs, and property management fees.
- Future Forecasting: You can plug in your assumptions for things like rent increases and property appreciation to see how your cash flow might look years down the road.
- Risk Assessment: What happens if interest rates go up or you get hit with a major repair bill? A calculator lets you stress-test your investment to see how well it holds up under pressure.
A calculator doesn’t give you a simple “good” or “bad” verdict. It shows you if a property is the right investment for your personal financial strategy and how much risk you’re comfortable with.
At the end of the day, using a calculator is all about building confidence. The clarity you get from this one simple step can be the difference between a profitable asset that builds wealth and a costly mistake that drains your bank account. If you’re still on the fence and asking yourself, “is real estate a good investment?”, running the numbers is the absolute best place to start.
By the time you finish this guide, you’ll be able to analyze any property and know for sure if it’s a smart move for you.
What Goes Into a Real Estate Investment Calculator?
Think of a real estate investment calculator like a professional chef’s recipe. The final dish—your investment analysis—is only as good as the ingredients you put in. Garbage in, garbage out. Let’s walk through the essential numbers you’ll need to gather to get a clear and accurate financial picture of any potential property.
Getting these details right is the first, and most important, step. Each number tells a piece of the property’s financial story, from what it costs to buy to what it costs to own. Nail these inputs, and you’re on your way to a reliable forecast.
This infographic really drives home the core benefits of a thorough analysis—it’s all about balancing the financial inputs with your time commitment and protecting yourself from risk.
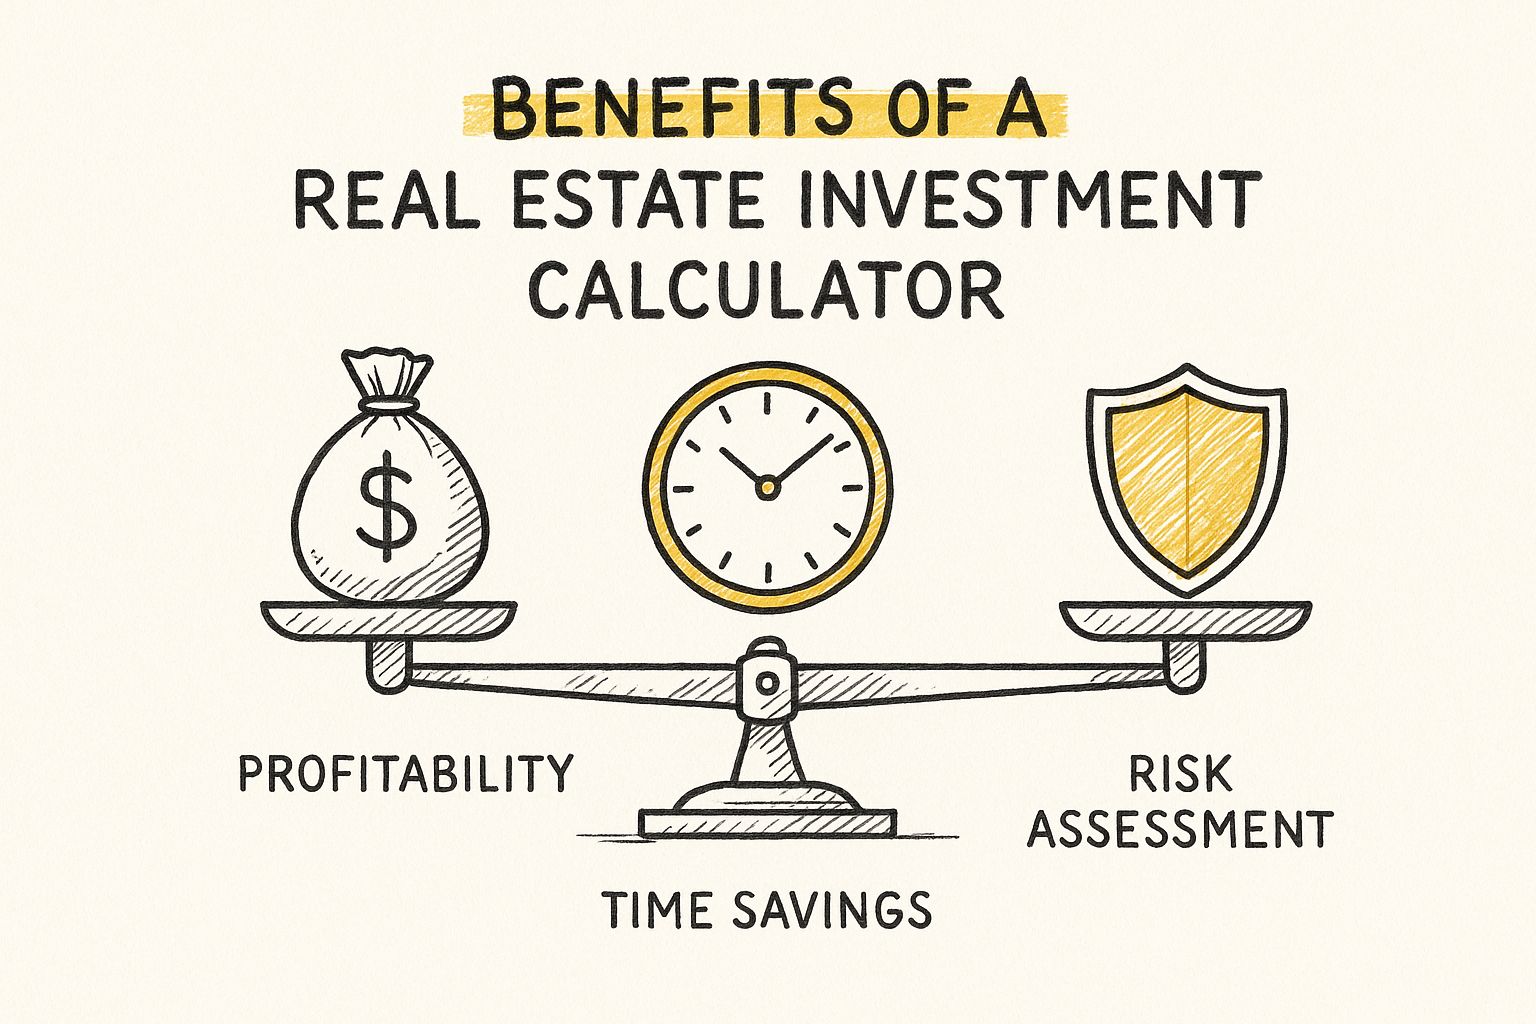
As you can see, smart investing isn’t just about the money. It’s about using the right tools to keep risk in check and make sure your time is spent wisely.
The Upfront Costs: Purchase and Financing
First things first, let’s look at the money needed to actually acquire the property. These numbers form the foundation of your entire financial breakdown.
- Purchase Price: This one’s simple—it’s the price you agree to pay for the property. It’s the starting block for almost every other calculation, from your down payment to your loan amount.
- Down Payment: This is the cash you bring to the table. It’s usually a percentage of the purchase price, often around 20% for investment properties. A bigger down payment means a smaller loan, which translates to a lower monthly mortgage payment.
- Loan Details (Interest Rate & Term): These two figures dictate how much you’ll pay the bank each month. A lower interest rate or a longer loan term (like 30 years instead of 15) will give you a smaller monthly payment, which has a huge effect on your cash flow. If you’re fuzzy on the details, you can learn more about how to finance investment property in our complete guide.
These initial numbers are straightforward, but they set the stage for everything that follows.
The Ongoing Numbers: Income and Operating Expenses
Now we get into the nitty-gritty: the property’s income potential versus the real-world costs of keeping it running. This is where a lot of new investors trip up, usually by being way too optimistic about expenses.
A rookie mistake is to only focus on the mortgage payment. Real profit is what’s left after you subtract all the other operating expenses from the rent you collect.
Learning to accurately forecast these costs is what separates a cash-flowing asset from a money pit.
Essential Inputs for Your Real Estate Investment Calculator
The table below breaks down the critical data points you need for an accurate analysis. It covers what each metric means, why it’s so important, and where you can typically find the information.
| Input Metric | Description | Why It’s Important | Common Source |
|---|---|---|---|
| Gross Monthly Rent | The total rent you collect each month, assuming the property is always occupied. | This is your top-line revenue—the money that has to cover every single expense and, hopefully, leave a profit. | Check rental listing sites, talk to local realtors, or review current lease agreements. |
| Property Taxes | The annual tax bill from your local government, usually paid monthly or yearly as part of your mortgage. | This is a big, non-negotiable expense that comes directly out of your income. | Find this on the county tax assessor’s website or a recent tax bill for the property. |
| Property Insurance | Your landlord or homeowner’s insurance policy that protects against damage and liability. | Absolutely essential for managing risk. It’s a fixed cost that impacts your bottom line. | Get quotes from a few different insurance providers to compare rates. |
| Vacancy Rate | The percentage of time you realistically expect the property to be empty between tenants. | Assuming 100% occupancy is a fantasy. A 5-8% vacancy rate prepares you for the reality of turnover. | Ask local property managers or find market data for your specific area. |
| Maintenance & Repairs | Your budget for everything from a leaky faucet to a new coat of paint. | This is the fund that keeps small problems from becoming huge, expensive ones. It’s very easy to underestimate. | A good rule of thumb is to budget 1% of the property’s value per year. |
Getting a handle on these inputs is half the battle. Once you have solid numbers here, you can trust the outputs your calculator gives you.
Understanding the Metrics That Matter
Once you’ve punched in all the numbers, a real estate investment calculator gets to work, translating that raw data into a handful of powerful metrics. Think of these outputs as the financial health report for a potential property. Learning to read them is the single most important skill for spotting a winner and, just as crucially, avoiding a dud.
Let’s break down the four most important numbers your calculator will spit out. We’ll start with the most basic concept—monthly profit—and build from there, giving you a clear framework for how to analyze any deal.
Cash Flow: The Monthly Report Card
Cash Flow is the most immediate and gut-check metric of them all. It’s simply the money left in your pocket each month after you’ve collected rent and paid all the bills—mortgage, taxes, insurance, maintenance, you name it.
- Positive Cash Flow: This is the goal. More money is coming in than going out, meaning the property is paying for itself and putting a little extra in your bank account.
- Negative Cash Flow: This is a red flag. You’re spending more to keep the property running than you’re earning in rent, forcing you to feed it cash out of your own pocket every month.
Think of cash flow as the property’s monthly salary. A positive salary means it’s a productive asset. A negative one means it’s a liability that’s costing you money.
Cash-on-Cash Return: The Efficiency Score
While cash flow tells you if you’re making a profit, Cash-on-Cash (CoC) Return tells you how hard your invested money is actually working for you. It measures your annual pre-tax cash flow against the total amount of cash you personally invested to buy the place (your down payment, closing costs, and initial repair budget).
CoC Return = (Annual Pre-Tax Cash Flow / Total Cash Invested) x 100
This is an incredibly powerful metric because it focuses purely on the return from your out-of-pocket cash. A property with a $200 monthly cash flow might not sound as exciting as one with $300, but what if the first only required a $20,000 investment while the second cost you $50,000? Suddenly, that first property looks like a much more efficient use of your capital.
Many savvy investors aim for a CoC return of 8-12% or higher. To get a better feel for what makes a good return, you can learn more about the average rate of return across different types of investments.
Cap Rate: The Universal Comparison Tool
The Capitalization Rate, or Cap Rate, is what pros use to quickly size up deals and compare properties on an even playing field, completely ignoring the financing. It measures a property’s income potential relative to its current market value.
- Net Operating Income (NOI): This is all your rental income minus all operating expenses, before you factor in any mortgage payments.
- Cap Rate Formula: Cap Rate = (NOI / Property Value) x 100
Because it strips out the mortgage details, the Cap Rate lets you make an apples-to-apples comparison. A higher Cap Rate often points to a higher potential return, though it can sometimes signal higher risk. It’s a fantastic tool for getting a feel for market values and spotting potentially underpriced assets.
Return on Investment (ROI): The Big Picture
Finally, Return on Investment (ROI) gives you the most complete, long-term view of how an asset is performing. It’s the granddaddy of all metrics because it looks beyond just the monthly cash flow.
ROI accounts for all the ways a property builds your wealth over time—including appreciation in value and the equity you build as you pay down the mortgage.
Mastering these four key metrics is how you graduate from simply running numbers to making truly strategic investment decisions. Each one offers a different, essential lens for evaluating a property’s real financial potential.
Analyzing Real-World Investment Scenarios
Okay, the theory and formulas are essential, but where the rubber really meets the road is in the real world. Let’s put a real estate investment calculator to the test by running the numbers on two completely different properties. This is how you move from just knowing the metrics to actually understanding the story the numbers are telling you.
Walking through these examples will show you just how quickly a calculator can shine a light on opportunities—or wave a big red flag over risks—that you might not see at first glance. It’s the bridge between a spreadsheet full of numbers and a confident investment decision.
Scenario Comparison: Suburban SFR vs. Urban Duplex
To illustrate how a calculator reveals the true nature of a deal, let’s compare two common investment types: a single-family rental (SFR) in a stable suburb versus a duplex in an up-and-coming urban area.
| Metric | Scenario 1: Suburban SFR | Scenario 2: Urban Duplex |
|---|---|---|
| Purchase Price | $350,000 | $450,000 |
| Total Cash Invested | $80,000 | $130,000 |
| Gross Monthly Rent | $2,600 | $4,000 ($2,000/unit) |
| Monthly Expenses (PITI, Mgmt, etc.) | $2,683 | $3,695 |
| Monthly Cash Flow | -$83 | +$305 |
| Cash-on-Cash Return | -1.25% | 2.82% |
| Cap Rate | 4.48% | 6.2% |
| Primary Goal | Long-term Appreciation | Immediate Monthly Income |
Real-Life Example 1: The Suburban Single-Family Rental
First up, a classic: a three-bedroom, two-bathroom house in a growing suburban neighborhood. Think good schools, steady demand from families—the kind of place you buy for long-term appreciation and hopefully, some reliable monthly cash flow.
Input Data:
- Purchase Price: $350,000
- Down Payment (20%): $70,000
- Closing Costs & Repairs: $10,000
- Total Cash Invested: $80,000
- Loan Amount: $280,000 at 6.5% interest (30-year fixed)
- Gross Monthly Rent: $2,600
- Expenses (Taxes, Insurance, Vacancy, Repairs, PM): $993/month
Analysis:
The calculator reveals a monthly cash flow of -$83. This means I would have to pay out of pocket each month to own this asset. The Cash-on-Cash return is negative, and the Cap Rate of 4.48% is low, suggesting the property is overpriced relative to its income potential. Verdict: For an investor seeking cash flow, this is a clear “no-go.” The calculator saved me from a costly mistake driven by the appeal of a “nice” neighborhood.
Real-Life Example 2: The Urban Duplex
Next, let’s look at a duplex in a city neighborhood that’s on the upswing. It’s close to a university and public transit, which often means strong rental demand. The goal here is different: maximize monthly income.
Input Data:
- Purchase Price: $450,000
- Down Payment (25%): $112,500
- Closing Costs & Repairs: $17,500
- Total Cash Invested: $130,000
- Loan Amount: $337,500 at 7.0% interest (30-year fixed)
- Gross Monthly Rent (Total): $4,000 ($2,000 per unit)
- Expenses (Taxes, Insurance, Vacancy, Repairs, PM): $1,675/month
Analysis:
The analysis shows a positive cash flow of $305 per month. This meets my primary goal. However, the Cash-on-Cash return is a modest 2.82%. This tells me that a large amount of my capital is tied up for a relatively small return. The Cap Rate of 6.2% is much healthier. Verdict: This is a viable investment, but the data empowers me to negotiate. I can go back to the seller with these numbers and aim for a lower purchase price to improve my CoC return, turning a decent deal into a great one. Before pulling the trigger, it’s always a good idea to confirm if you can afford an investment property based on these kinds of real-world projections.
These local scenarios are playing out against a massive global backdrop. In the second quarter of 2025 alone, direct real estate transaction volumes hit US$179 billion worldwide, a 14% jump from the previous year. With the Americas leading the charge at US$99 billion in deals, it’s more critical than ever to ground your local decisions in solid data. A good calculator helps you do just that. You can discover more insights about global real estate trends on jll.com.
Choosing the Right Investment Calculator
Not all real estate calculators are built the same. Think of it like a carpenter’s toolbox—you wouldn’t use a sledgehammer for finish work. The right calculator for you depends entirely on your goals, the complexity of the deals you’re looking at, and just how deep you need to dig into the numbers.
The options out there run the gamut from simple, free web tools to sophisticated software suites. Picking the right one means getting the clarity you need without drowning in features you’ll never touch. For most people just getting their feet wet, a free online calculator is the perfect place to start.
Free Online Calculators
Free tools are your go-to for quick, back-of-the-napkin math. They’re brilliant for sifting through a long list of potential properties and quickly tossing out the ones that are obvious duds.
- Best for: First-time investors, initial deal screening, and analyzing single-family homes.
- Strengths: Super easy to use, no cost, and they give you the essential metrics like cash flow and Cash-on-Cash Return.
- Limitations: They usually don’t let you account for variable expenses, model future rent growth, or get into the weeds on tax implications.
Treat these as your first-pass filter. They give you the core numbers to decide if a property is even worth a second, more serious look.
Paid Software and Advanced Spreadsheets
Once you’ve got a few deals under your belt or start looking at more complex properties like apartment buildings, you’re going to need more firepower. This is where paid software or a custom-built spreadsheet comes in.
These powerful tools let you model much more intricate financial situations. You can plug in things like changing vacancy rates over time, project a property’s appreciation, and see the real financial impact of big-ticket repairs down the road. They transform a simple calculation into a dynamic, long-term financial forecast.
The right calculator evolves with you. You might start with a basic tool for your first rental, but as you build a portfolio, you’ll need a system that can handle the growing complexity of your investments.
This need for more detailed analysis is crucial when you consider how much markets can differ. For instance, while the commercial real estate sector was recovering in early 2025, performance varied wildly by region. The Americas saw a 12% year-over-year jump in property sales, but Europe actually saw a 15% decline. Advanced tools are what allow you to model these kinds of regional economic factors and project performance with any real accuracy. You can learn more about the 2026 real estate outlook from Deloitte to see just how different these forecasts can be.
Free vs. Paid Real Estate Investment Calculators
To help you decide which path is right for you, it helps to see a direct comparison. Here’s a breakdown of what you get with free tools versus more advanced paid options.
| Feature | Free Calculators | Paid Tools / Advanced Spreadsheets |
|---|---|---|
| Cost | Free | Varies (one-time fee or subscription) |
| Complexity | Low (simple inputs) | High (detailed, customizable inputs) |
| Best Use Case | Quick screening, single-family rentals | In-depth analysis, multi-unit properties, portfolio management |
| Long-Term Projections | Limited or none | Advanced (rent growth, appreciation, inflation) |
| Tax Analysis | Basic or none | Detailed depreciation and tax benefit modeling |
| Customization | Low | High (can model unique deal structures) |
At the end of the day, the best real estate investment calculator is the one you’ll actually use, consistently. Start with a simple, free tool to build the habit of running the numbers on every single deal that crosses your desk. As your needs grow, you can graduate to a more powerful solution that gives you the deeper insights you need to manage and scale a successful portfolio.
Advanced Strategies and Common Mistakes to Avoid
Once you’ve got the hang of the basic outputs, the real power of a real estate investment calculator comes into play. It’s not just about running the numbers once; it’s about using it as a strategic tool to manage risk and find the hidden flaws in a potential deal. This is what separates seasoned investors from those who get blindsided down the road.
One of the best ways to do this is with sensitivity analysis. Think of it as a financial “stress test” for your property. Instead of plugging in one set of optimistic numbers, you deliberately poke and prod your assumptions to see how the investment holds up under pressure. It’s how you find out just how much can go wrong before your great deal turns sour.
Performing a Sensitivity Analysis
A good sensitivity analysis is all about asking tough “what if” questions. It helps you see the future’s possibilities—both good and bad—and build a margin of safety into your investment.
- What if vacancy is higher? Your broker might say 5% is standard, but what does the math look like at 10% or even 15%? Does the property still generate positive cash flow, or is it bleeding money?
- What if interest rates rise? This is a huge one, especially with a variable-rate loan. Model what happens to your mortgage payment and your cash flow if rates jump by 1% or 2%.
- What if rents soften? Forget about projecting rent growth for a moment. What happens if the market gets competitive and you have to drop the rent by $100 a month just to find a good tenant?
Running these scenarios shows you exactly where the property’s financial breaking point is. You’ll know precisely how much wiggle room you have before a deal goes from a winner to a liability.
Common (and Costly) Calculator Mistakes
A calculator is only as smart as the numbers you put into it. Unfortunately, it’s all too easy for new investors to feed it overly optimistic assumptions, creating a rosy picture that doesn’t match reality. Avoiding these common mistakes is absolutely critical.
“The biggest mistake I see is investors confusing projections with reality. A calculator is a tool for modeling possibilities, not a crystal ball. Your inputs must be grounded in conservative, real-world data.”
Here are the most frequent blunders to watch out for:
- Underestimating Capital Expenditures (CapEx): This isn’t your day-to-day repair budget. CapEx is for the big-ticket items that inevitably fail: a new roof ($10,000+), a new HVAC system ($8,000+), or foundation work. If you’re not setting aside 5-10% of the gross rent for these future disasters, you’re setting yourself up for a painful financial hit.
- Ignoring Vacancy Entirely: Believing your property will be occupied 100% of the time is pure fantasy. Tenants move out, and it takes time and money to find new ones. Factoring in a conservative 5-8% vacancy rate is non-negotiable for an accurate analysis.
- Relying on “Pro Forma” Numbers: “Pro forma” is just a fancy term for the seller’s projected financials. They are almost always inflated to make a property look more profitable than it is. Always, always do your own due diligence by verifying the numbers with actual leases, utility bills, and bank statements.
- Forgetting Hidden Tax Implications: Profit isn’t just about cash flow; it’s about what you keep after taxes. Understanding your tax situation is crucial. To get a better handle on this, it’s smart to look into all the available property investment tax deductions that can make a huge difference in your net return.
By stress-testing your assumptions and sidestepping these common errors, you turn a real estate investment calculator from a simple number-cruncher into an essential part of your strategic toolkit.
Frequently Asked Questions (FAQ)
You’ve got the basics down, but that’s usually when the real questions start popping up. Let’s tackle some of the most common things investors ask when they start running the numbers.
1. What’s the single most important metric for a beginner to watch?
For a beginner, the most critical metric is Cash Flow. While other metrics like CoC Return and Cap Rate are vital for comparing deals, cash flow is the immediate health report of your investment. A positive cash flow means the property supports itself and pays you; a negative cash flow means you are paying to own it each month.
2. How can I get realistic estimates for operating expenses?
Never rely solely on the seller’s numbers. Do your own due diligence.
- Taxes: Check the county tax assessor’s official website for the most recent tax bill.
- Insurance: Call an insurance agent and get a specific quote for a landlord policy on the property.
- Repairs/Maintenance: The “1% Rule” is a solid starting point—budget 1% of the purchase price annually for maintenance. For older properties, you may want to increase this to 1.5-2%.
3. What is a “good” Cash-on-Cash (CoC) Return?
While this depends on your market and risk tolerance, a common benchmark for a good CoC return on a long-term rental is 8% to 12%. Anything below this might suggest your capital could be working harder elsewhere, while anything significantly higher warrants a closer look to ensure the risks aren’t too high.
4. Can a calculator predict a property’s future appreciation?
No. A calculator is a tool for analysis, not a crystal ball. It models outcomes based on the assumptions you provide. Appreciation is a market-driven factor. You can project potential appreciation in an advanced calculator, but always treat it as a potential bonus, not a guaranteed return. Base your deal analysis on the property’s performance today.
5. How much does the vacancy rate really affect my numbers?
Dramatically. A property that looks profitable with 0% vacancy can quickly turn into a money pit when you plug in a realistic 5-8% vacancy rate. A small change in this one input can be the difference between positive and negative cash flow. Always be conservative and factor it in.
6. What’s the main difference between Cap Rate and ROI?
Cap Rate is used for a quick, unleveraged comparison of properties. It ignores financing, telling you the raw return a property generates relative to its price. It’s for comparing Property A to Property B. Return on Investment (ROI) is a broader, long-term metric that includes financing, appreciation, and equity buildup. It tells you the total wealth a property is generating for you personally.
7. Should I include management fees if I plan to self-manage?
Yes, always. Your time has value. By including a standard management fee (typically 8-10% of gross rent) in your calculations, you are paying yourself for your labor. It also ensures the investment remains viable if you later decide to hire a professional manager.
8. How often should I re-analyze my existing properties?
Conduct an annual financial check-up on your portfolio. Re-running the numbers helps you track performance, identify rising expenses (like taxes or insurance), and make informed decisions about when to raise rents or refinance your mortgage.
9. How do I budget for Capital Expenditures (CapEx)?
CapEx are large, infrequent expenses like a new roof or HVAC system. They are not the same as routine maintenance. A prudent method is to set aside a separate reserve fund by allocating 5-10% of the monthly gross rent specifically for future CapEx.
10. Can I use a standard calculator for commercial properties like office buildings?
While the core principles are similar, commercial properties often require a more specialized calculator. They involve different lease structures (like triple-net leases), tenant improvement allowances, and more complex income streams that a standard residential calculator isn’t designed to handle accurately.
Ready to take the next step in your investment journey? Top Wealth Guide provides the insights and tools you need to build your portfolio with confidence. Explore our resources and start making smarter investment decisions today. Learn more at topwealthguide.com.
2 Comments
Pingback: 12 Best Real Estate Investment Apps of 2025: A Deep Dive
Pingback: How to Calculate Rental Yields Accurately: A Complete Guide