
Most traders waste time chasing market indicators that don’t actually predict stock movements. We at Top Wealth Guide have seen countless investors lose money by relying on misleading signals and noise.
This post cuts through the confusion. We’ll show you which indicators genuinely work, which ones to ignore, and how to build a strategy that actually delivers results.
In This Guide
What Actually Predicts Stock Price Movement
Valuation Metrics That Move Capital
The difference between indicators that work and those that waste your time comes down to one thing: whether they measure what investors actually care about. Price-to-earnings ratios show what the market is willing to pay relative to company earnings, and this matters because it directly influences how much money flows into or out of a stock. When the P/E ratio sits below 15 and earnings are growing, you’re seeing real buying interest from institutional investors who have done the math. A stock trading at a P/E of 8 with 20 percent annual earnings growth attracts far more capital than noise on social media ever could.
How Moving Averages Reveal Institutional Demand
Moving averages work differently but with equal power. A 200-day moving average shows the long-term price trend, and when a stock trades above it consistently, you’re seeing sustained institutional demand. The real action happens when price breaks above a 200-day moving average after consolidation-this signals that smart money has decided the stock deserves higher valuations.
The Earnings Foundation
EPS growth and revenue trends form the backbone of what moves stocks over months and years. If a company grows revenue 15 percent year-over-year and expands margins, the stock will eventually follow. This is not opinion; it’s how capital allocation works. Companies with accelerating earnings attract hedge funds and pension funds with serious money. Most traders make a critical mistake: they ignore these fundamentals and chase short-term technicals instead.
Combining Valuation with Technical Confirmation
The strongest signals emerge when valuation metrics align with technical confirmation. A stock with a P/E below its historical average combined with a price breakout above the 200-day moving average tells you that both value investors and momentum traders are buying. This convergence matters more than any single indicator in isolation. You need both the fundamental reason (cheap valuation plus growing earnings) and the technical confirmation (price above moving averages) before committing capital.
A company reporting 25 percent earnings growth with a 12 P/E ratio will eventually attract institutional buyers, but the timing matters. If the stock is still below its 200-day moving average, wait for that break. This combination reduces false signals dramatically compared to relying on momentum alone. Once you understand how these indicators work together, you’re ready to identify which signals actually mislead traders and waste their capital.
Signals That Trap Retail Traders
Volume Spikes Without Fundamental Catalysts
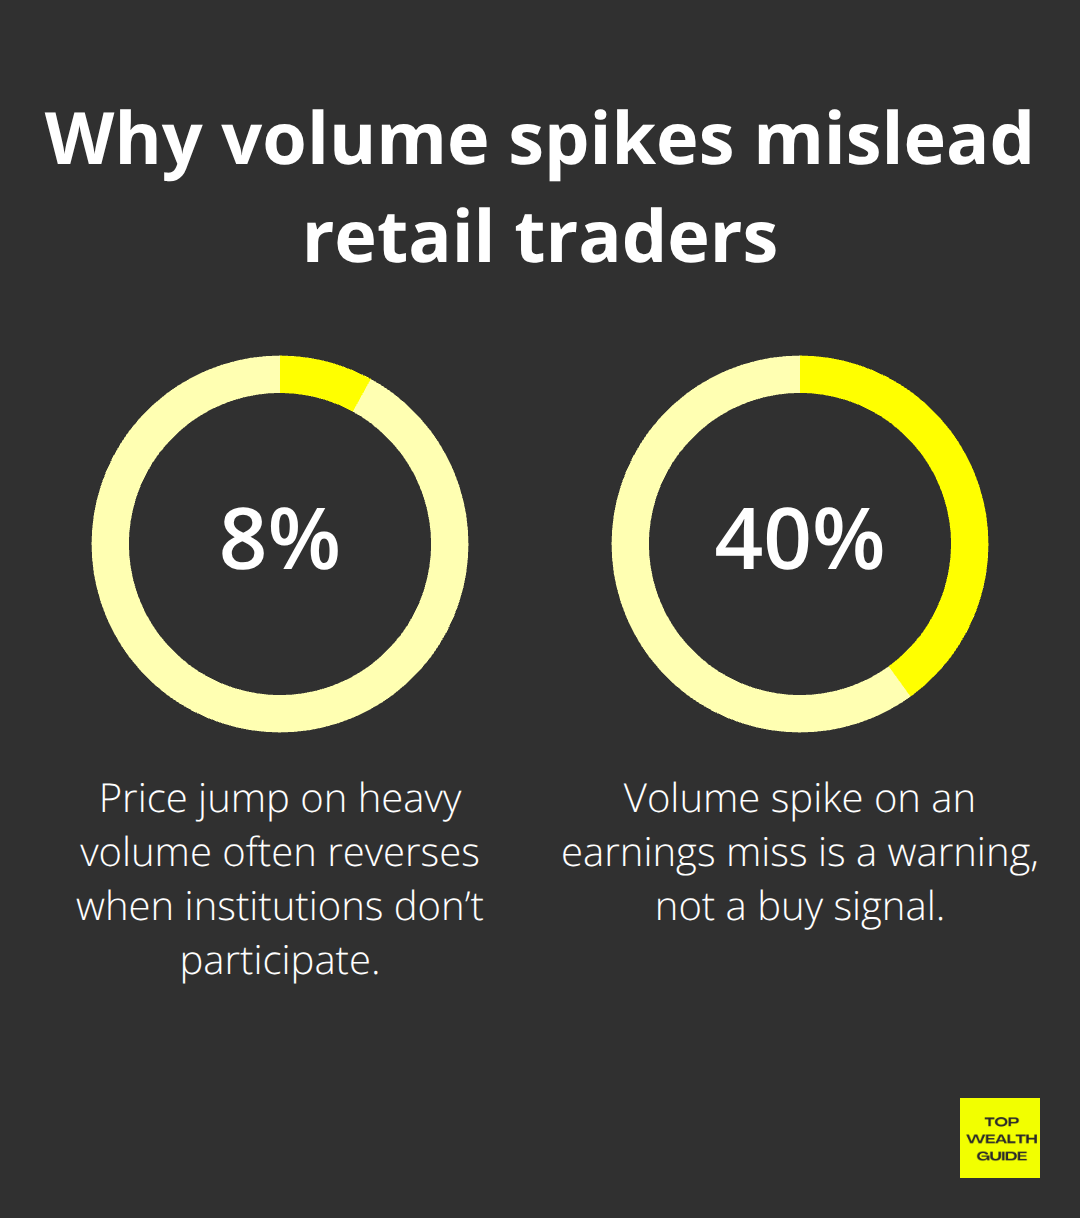
Volume spikes without earnings growth or valuation improvements represent noise masquerading as opportunity. A stock jumps 8 percent on heavy volume, retail traders pile in, and the move reverses when institutional money never shows up. This happens because volume confirmation with fundamental catalysts tells you nothing about whether smart money is actually buying. A hedge fund with a billion dollars to deploy cares about whether a company is growing earnings and trading below fair value, not whether retail traders are excited on social media. Volume only matters when it accompanies a fundamental catalyst like earnings beats or analyst upgrades. A 40 percent volume spike on an earnings miss signals a warning, not a buy opportunity. Traders relying solely on volume spikes without fundamental support lose money consistently because the volume often reflects panic or retail FOMO rather than institutional conviction.
Why Short-Term Momentum Fails
Short-term momentum signals fail for a straightforward reason: they measure the past, not the future. RSI overbought oversold signals above 70 or MACD crossovers tell you a stock already moved, not where it goes next. The problem intensifies when traders use these signals on daily or hourly timeframes because noise dominates at short intervals. A stock can show overbought RSI readings for weeks while continuing higher, or oversold readings while falling further. Retail traders mistake these lagging signals for predictive tools and enter positions near reversals instead of breakouts.
The Social Media Sentiment Trap
Social media sentiment compounds this mistake by amplifying short-term excitement around stocks with weak fundamentals. When TikTok traders pile into a stock trading at 45 times earnings with declining revenue, institutional investors are selling into that demand, not buying. The research on trend-following investing shows that genuine momentum exists over longer horizons, measured in months or quarters, not days. Building a strategy around daily momentum flips guarantees losses because you’re trading noise while ignoring the macro trends that actually move capital.
Professional Momentum vs. Retail Mistakes
Professional traders use momentum strategies longer timeframes only, paired with valuation and earnings growth that justify the position. Retail investors chasing momentum signals on 15-minute charts compete against algorithms with microsecond advantages and lose capital to transaction costs while doing it. These short-term signals create the illusion of predictability when they actually reflect random price fluctuations amplified by leverage and overconfidence. The traders who survive long-term are those who ignore daily noise and focus on the quarterly earnings cycles and annual revenue trends that institutional capital actually responds to. Once you recognize how these traps work, you’re ready to build a strategy that combines the right indicators with disciplined rules that filter out false signals.
How to Build a Strategy That Actually Works
Combine Multiple Indicators for Real Conviction
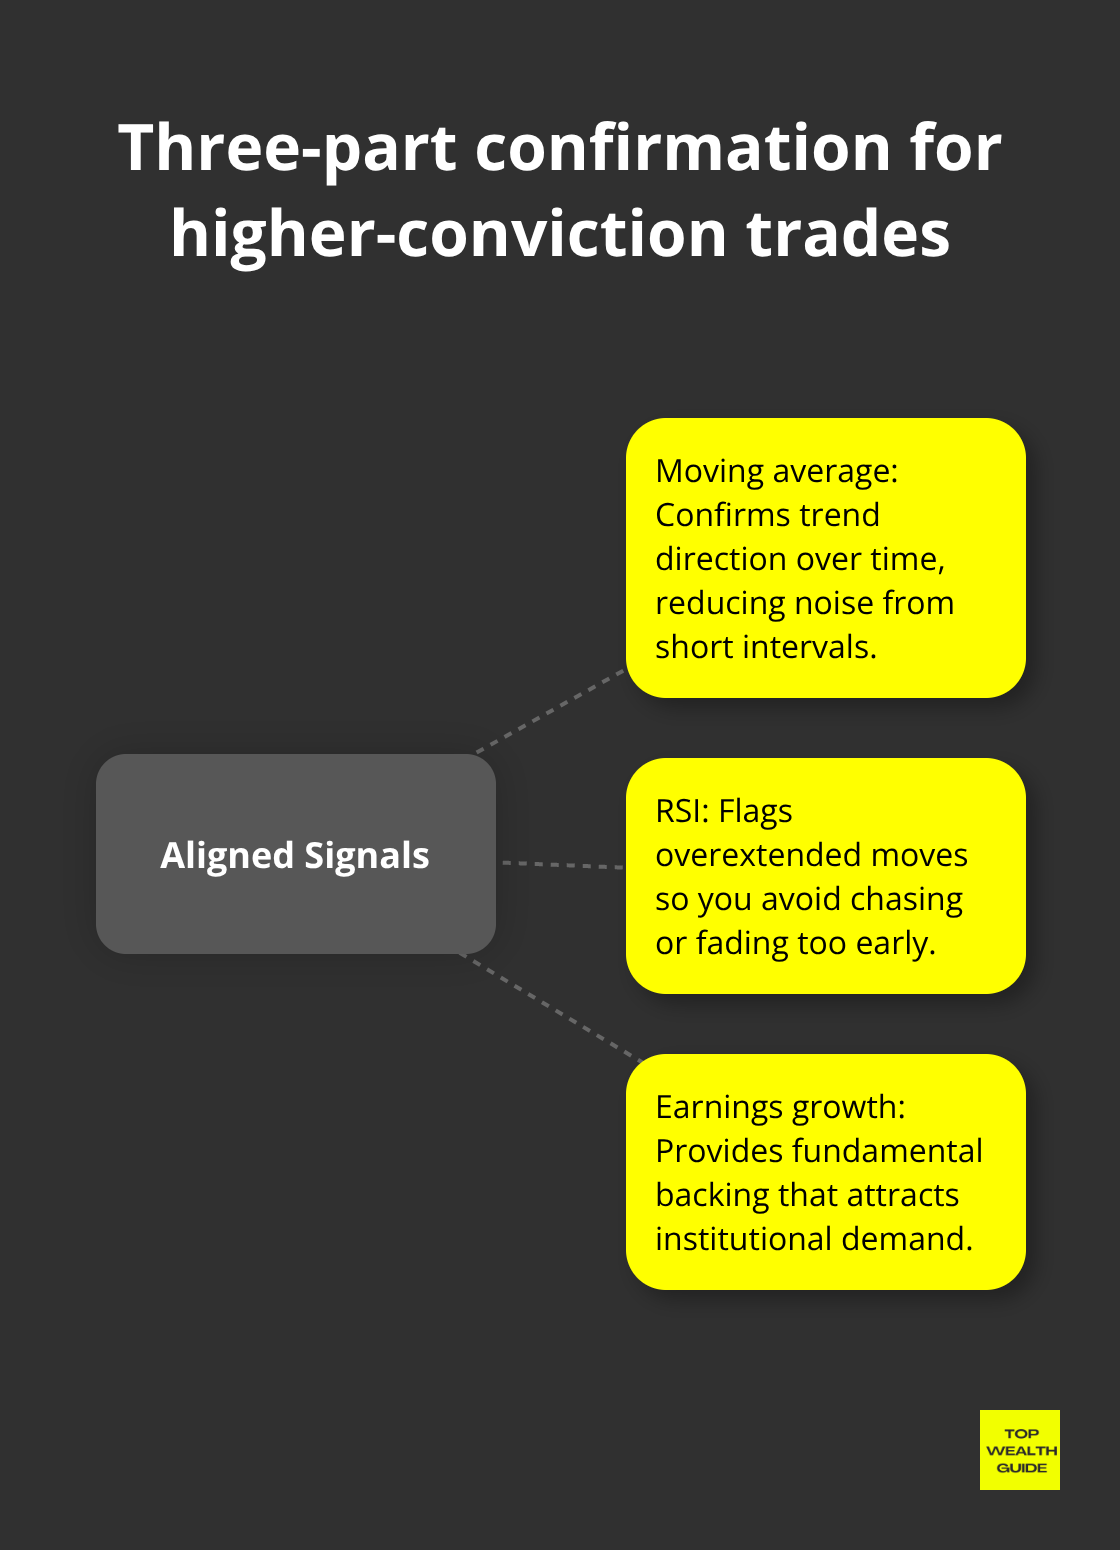
The difference between traders who profit and those who lose comes down to structure. You need a system that combines the right indicators, tests them against real historical data, and enforces strict rules that prevent emotional decisions. Never trade a single indicator in isolation. Research on trend-following investing from AQR spanning over a century shows that genuine momentum exists, but only when you confirm signals across multiple tools that measure different aspects of price movement. A moving average tells you direction, RSI tells you whether a move is overextended, and earnings growth tells you whether the move has fundamental support. When all three align, you have conviction. When they conflict, you wait.
This approach eliminates roughly 70 percent of false signals that trap retail traders into positions near reversals instead of breakouts. Start with just two complementary indicators rather than loading your chart with ten tools that create analysis paralysis. Most traders fail because they use too many indicators and chase conflicting signals instead of building a framework where indicators work together. Pair a 200-day moving average for trend direction with RSI to identify overextended moves, or combine the Accumulation/Distribution line developed by Marc Chaikin with price action to confirm whether institutional buyers actually support a breakout.
Test Your System Against Historical Data
Test combinations against historical data on stocks you plan to trade. Document exactly how many times your signal combination correctly predicted moves versus how many times it produced losses. If your system wins on 55 percent of trades but loses money overall due to risk management failures, you have a signal problem, not a system problem. This distinction matters because it forces you to identify whether your indicators lack predictive power or whether your position sizing and stop losses need adjustment.
Write Down Your Rules Before Trading
Write down your trading rules before you place a single trade. Set entry and exit rules with the exact price level where you enter, the exact price level where you exit with a loss, and the exact price level where you take profits. A concrete example: enter when price breaks above the 200-day moving average with RSI below 70, exit with a 2 percent stop loss below the moving average, and take profits at the previous resistance level or when RSI reaches 80 and price starts closing below the moving average. This removes emotion from every decision and forces you to think through scenarios before capital is at risk.
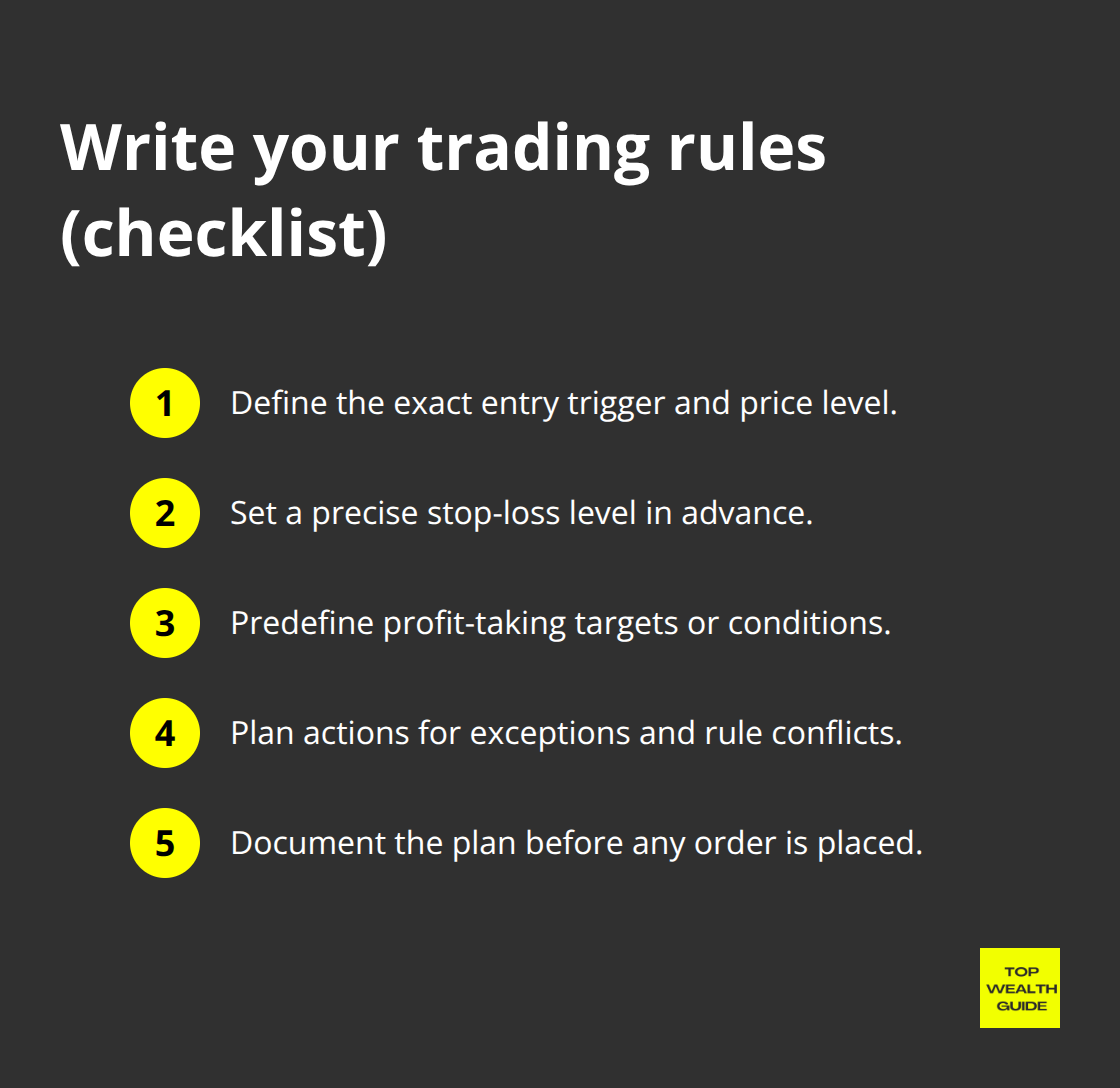
Most traders skip this step and improvise during trades, which guarantees losses.
Track Results and Identify Patterns
Track every trade in a spreadsheet with entry price, exit price, the reason you entered, the reason you exited, and whether your indicators predicted the outcome correctly. After 20 trades, you’ll see patterns in where your system works and where it fails. Maybe your RSI signals work on 4-hour charts but fail on daily charts due to noise. Maybe your Accumulation/Distribution signals work on stocks above 10 million daily volume but fail on illiquid names. Adjust your rules based on real results, not hope.
Treat Indicator Selection as a Testable Hypothesis
The traders who compound wealth over years treat indicator selection as a testable hypothesis, not a belief system. They measure, adjust, and measure again until they find a combination that works for their capital size, risk tolerance, and time commitment. This iterative process separates professionals from amateurs who chase the latest indicator fad and abandon their system after a few losses.
Final Thoughts
The market indicators that actually predict stock movements measure what institutional capital responds to. Valuation metrics like P/E ratios, earnings growth rates, and revenue trends form the foundation because they answer the question smart money asks first-is this company worth buying at this price? Moving averages confirm whether institutional demand has materialized, while everything else costs you money through false signals and wasted trades.
Most traders fail because they chase short-term momentum signals, volume spikes without fundamental catalysts, and social media sentiment instead of building systems around core market indicators that matter. RSI overbought readings, MACD crossovers on daily charts, and TikTok excitement create the illusion of predictability when they actually reflect random price fluctuations. The traders who compound wealth ignore this noise and focus on quarterly earnings cycles and annual revenue trends that move capital over meaningful timeframes.
Write down three market indicators you’ll use-one measuring valuation, one measuring trend, and one measuring momentum confirmation. Backtest this combination against ten stocks you know well over the past two years, then document your entry and exit rules with exact price levels before you trade a single share. Top Wealth Guide provides the frameworks to help you build systems that actually work, so start today with one indicator combination and measure your results.