
Cracking the code to successful real estate investing isn’t about stumbling upon a lucky find—it’s about doing your homework. A thorough real estate investment property analysis is hands-down the most important skill you can develop. It’s what protects your hard-earned cash, helps you spot opportunities others miss, and gives you the confidence to pull the trigger on a deal.
Think of it as the structured process that transforms a hopeful purchase into a predictable, cash-flowing asset.
In This Guide
- 1 Why Property Analysis Is Your Secret Weapon
- 2 Mastering the Key Financial Metrics
- 3 Sizing Up the Market and Your Competition
- 4 Your Due Diligence and Risk Mitigation Checklist
- 5 Taking Your Analysis to the Next Level with Modern Tools
- 6 Frequently Asked Questions (FAQ)
- 6.1 1. What’s a good cap rate for an investment property?
- 6.2 2. How much should I budget for repairs and maintenance?
- 6.3 3. What is the single biggest mistake new investors make in property analysis?
- 6.4 4. Should I focus on cash flow or appreciation?
- 6.5 5. What is "analysis paralysis" and how do I avoid it?
- 6.6 6. How do I accurately estimate rental income?
- 6.7 7. What's the difference between Cap Rate and Cash-on-Cash Return?
- 6.8 8. How important is a professional property inspection?
- 6.9 9. Can I do my own property analysis without software?
- 6.10 10. How is analyzing a multi-family property different from a single-family home?
Why Property Analysis Is Your Secret Weapon
At its heart, property analysis is a strategic toolkit. It lets you peer behind the fresh paint and nice landscaping to see a property for what it really is: a financial instrument. If you skip this step, you’re not investing; you’re gambling.
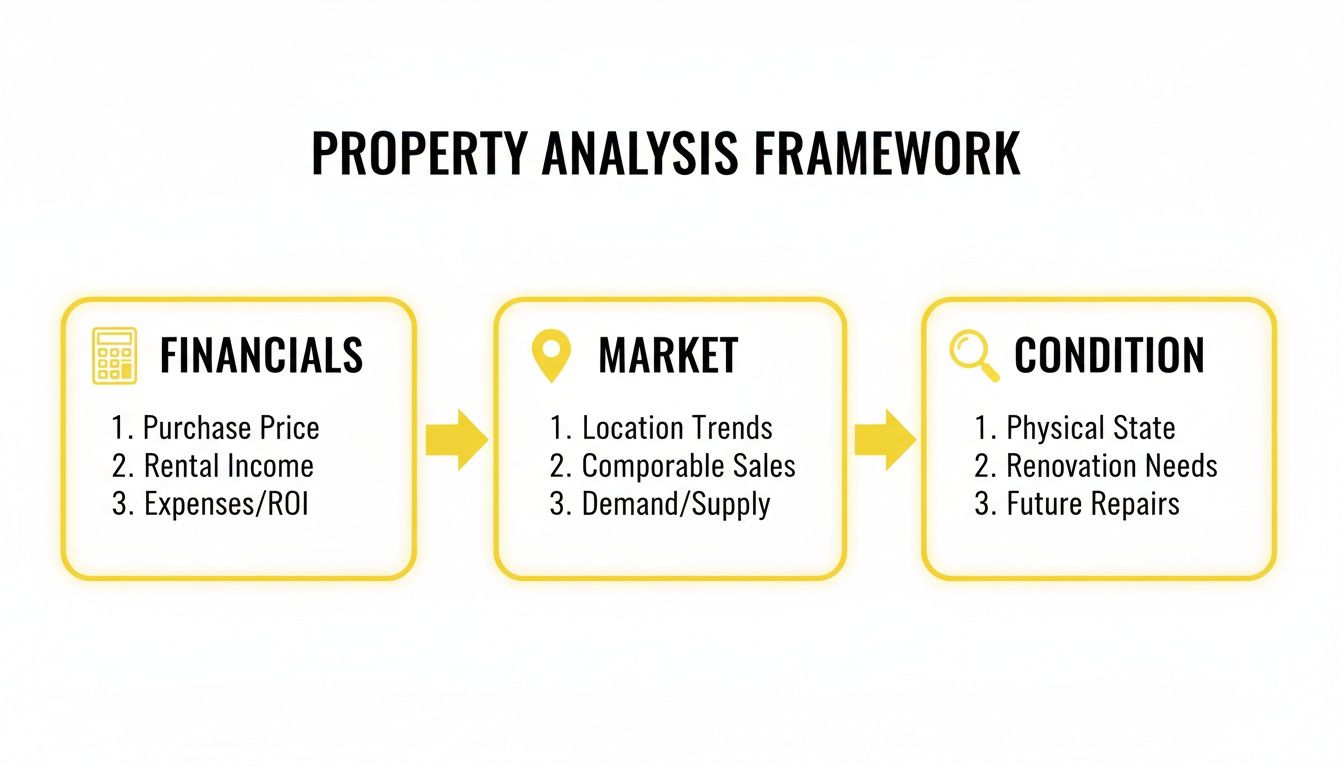
Proper analysis gives you a framework for your decisions, forcing you to focus on the things that actually matter. I've found that every solid deal rests on three core pillars.
To give you a clearer picture, here's how these three essential components work together.
The Three Pillars of Property Analysis At a Glance
| Pillar | Primary Goal | Key Questions to Answer |
|---|---|---|
| Financial Feasibility | Determine profitability and return on investment. | Do the numbers actually work? Will this property generate positive cash flow after all expenses are paid? What are the key performance metrics telling me? |
| Market Context | Understand the external factors influencing the property's value and demand. | Is this a neighborhood on the rise or in decline? What are the job growth, population trends, and rental demand like? How does this property stack up against comparable local listings (comps)? |
| Physical Condition | Uncover the true state of the asset and identify potential capital expenditures. | What is the real condition of the roof, HVAC, foundation, and plumbing? Are there any major, budget-busting repairs lurking beneath the surface? |
Each pillar gives you a different piece of the puzzle. Overlook one, and you’re making a decision with incomplete, and potentially dangerous, information.
Where Analysis Makes or Breaks a Deal
Imagine two different investors looking at deals.
Investor A (The Analyst): She finds a duplex that looks a little rough around the edges. It's in a neighborhood with a new tech campus opening in 6 months, but the property itself is underperforming with below-market rents. She runs the numbers, calculating that even with minor cosmetic updates, she can raise rents by 20% to match local comps. Her inspection confirms only minor fixes are needed. She buys it, implements her plan, and creates a cash-flowing asset. This is a diamond in the rough that most people would pass over.
Investor B (The Gambler): He gets swept up by a property’s "charm" and the seller's polished pro forma. He skims the financials, skips the deep-dive due diligence, and closes the deal. A month later, he discovers a massive, undisclosed plumbing issue that will cost tens of thousands to fix. His initial projections are now completely worthless, and his new "investment" is a money pit.
This story plays out all the time. A solid analysis isn't just a box to check—it’s your best defense against catastrophic mistakes. If you're just getting started, our guide on whether real estate is a good investment is a great place to build your foundation.
The goal of analysis isn't to find a perfect property—it's to understand a property's imperfections so you can price them into the deal. Every problem has a price, and your analysis finds it.
Mastering the Key Financial Metrics
Once you've sized up a property and it seems to check the big-picture boxes—solid market, good condition, promising financials—it's time to get your hands dirty with the numbers. This is where gut feelings give way to hard data. A proper real estate investment property analysis isn't about guesswork; it’s about running the numbers to see if the deal truly holds up.
These calculations are the language of real estate investing, and fluency is non-negotiable.
As this shows, everything has to work together. A property with stellar financials in a declining market is a trap, just like a prime location with a crumbling foundation. You need all three pillars to be strong.
Calculating Net Operating Income
The absolute bedrock of any analysis is the Net Operating Income (NOI). You can think of NOI as the property's pure, unlevered annual profit. It’s what the asset earns before you factor in your personal mortgage or income taxes. Essentially, it tells you if the property itself is a profitable business, completely separate from how you finance it.
The formula is straightforward:
NOI = Gross Operating Income – Operating Expenses
Let's ground this in a real-world example: a duplex you’re looking at for a purchase price of $400,000. Each unit brings in $1,600 per month.
- Gross Scheduled Rent: $3,200/month comes out to $38,400/year.
- Vacancy Loss: No property stays 100% occupied. Let's be conservative and assume a 5% vacancy rate, which is a loss of $1,920 ($38,400 x 0.05).
- Gross Operating Income (GOI): This is what you actually expect to collect: $38,400 – $1,920 = $36,480.
Next, subtract your operating expenses—everything it takes to run the place. This includes property taxes, insurance, routine maintenance, property management fees, and any utilities you cover. For our duplex, let's say these total $14,400 for the year.
So, our NOI calculation is: $36,480 (GOI) – $14,400 (Expenses) = $22,080
That $22,080 is the money the property generates on its own, year in and year out.
Understanding the Capitalization Rate
With your NOI in hand, you can quickly find the Capitalization Rate (Cap Rate). The cap rate is an investor's back-of-the-napkin tool for comparing the relative value of different properties. It represents the rate of return you'd get if you bought the property with all cash.
Here's the formula:
Cap Rate = Net Operating Income / Purchase Price
For our duplex example:
$22,080 (NOI) / $400,000 (Price) = 0.0552, or a 5.52% Cap Rate.
A word of caution: It's tempting to just hunt for the highest cap rate, but that’s a rookie mistake. An unusually high cap rate for an area can be a red flag, often signaling higher risk, a rougher neighborhood, or a property needing significant work. The real power of the cap rate is in comparing it to the average for similar properties in the same neighborhood.
To get a better handle on what makes a good return in your market, you can explore our detailed guide on cap rates in real estate.
Finding Your Cash-on-Cash Return
While the cap rate tells you about the property's performance, the Cash-on-Cash (CoC) Return tells you about your performance. This is arguably the most important metric for investors using financing because it measures the return on the actual cash you pulled out of your pocket.
The formula is:
CoC Return = Annual Pre-Tax Cash Flow / Total Cash Invested
Let's stick with the duplex. Say you finance it with a 25% down payment on the $400,000 price, which is $100,000. Add in another $8,000 for closing costs.
- Total Cash Invested: $100,000 + $8,000 = $108,000.
Now, we need your annual cash flow. This is simply your NOI minus your yearly mortgage payments (debt service). If your total mortgage payment for the year is $17,500:
- Annual Cash Flow: $22,080 (NOI) – $17,500 (Debt Service) = $4,580.
Finally, we can find the CoC Return:
$4,580 / $108,000 = 0.0424, or a 4.24% Cash-on-Cash Return.
This number is powerful. It means that for every dollar you personally invested, you're earning a 4.24% return in the first year. It’s a direct measure of how hard your cash is working for you.
A Quick Look at Internal Rate of Return
For investors planning to hold a property for several years, there’s a more advanced, long-term metric: the Internal Rate of Return (IRR). While the other metrics give you a one-year snapshot, IRR projects the total annualized return over your entire ownership period.
It's more complex because it considers your initial investment, all the annual cash flows over the years, and the final profit you make when you sell, all while accounting for the time value of money. You'll typically need a spreadsheet or software like DealCheck to calculate it, but it gives you the most complete picture of an investment's total profitability from start to finish.
Metric Comparison: Financial Health vs. Investment Return
It's easy to get these numbers mixed up, but they each tell a different part of the story. Think of it as looking at the property's health versus your personal return. This table breaks it down.
| Metric | What It Measures | Best Used For | Example Calculation (from Duplex scenario) |
|---|---|---|---|
| NOI | The property's standalone annual profit before debt. | Evaluating the core profitability and operational efficiency of the asset itself. | $22,080 |
| Cap Rate | The unleveraged rate of return on the property's value. | Quickly comparing the relative value of similar properties in a specific market. | 5.52% |
| Cash-on-Cash | The return on your actual out-of-pocket cash investment. | Understanding your personal first-year return and the efficiency of your capital. | 4.24% |
| IRR | The total annualized return over the life of the investment. | Making complex, long-term investment decisions and comparing different asset types. | Varies based on hold period and sale price. |
By getting comfortable with these four metrics, you give yourself the tools to perform a sharp, data-driven real estate investment property analysis. It’s how you move from hoping a deal is good to knowing it is.
Sizing Up the Market and Your Competition

Let's get one thing straight: a property with perfect financials can still be a money pit if it’s in a declining neighborhood. The market and local competition are the invisible hands that will ultimately steer your investment's success, influencing everything from finding tenants to your long-term appreciation.
A truly comprehensive real estate investment property analysis has to look far beyond the four corners of the lot. You have to put on your detective hat and dig into what makes the surrounding area tick. After all, a property isn't an island; its value is directly tied to the economic health of its community.
Reading the Big-Picture Market Signals
Before you even think about specific listings, zoom out. You need a solid grasp of the city or region's economic trajectory. These macro trends are the engine that drives rental demand and property values.
Here's what I always look for first:
- Job Growth: Is the area attracting new employers or are existing ones expanding? A healthy, diverse job market is the #1 driver of population growth. A town that relies on a single industry is a much riskier bet than one with a varied economy.
- Population Trends: Are people moving in or out? You can find this data from the U.S. Census Bureau or local economic development reports. The trend lines will tell you a powerful story about the area's future.
- Infrastructure Projects: Keep an eye out for news on new transit lines, highway expansions, or major revitalization projects. These are billboard-sized signs of long-term investment and confidence in the area's growth.
I always ask myself one simple question: "Why would someone want to move here in five years?" If I can't come up with a concrete answer backed by real developments, I move on. For a deeper dive, check out our guide on how to do market research before any investment.
Running the Comps on Your Target Property
Once you have a property in your sights, it’s time to zoom back in. This is where a Comparative Market Analysis (CMA) comes into play. You’ll be scrutinizing similar, nearby properties—what we call "comparables" or "comps"—to achieve two critical goals: making sure you don't overpay and confirming your rent estimates are actually realistic.
You need to pull two distinct sets of comps:
- Sales Comps: These are recently sold properties that mirror your target in size, age, condition, and location. This is how you nail down a fair market value.
- Rental Comps: These are similar properties currently for rent or just leased. This step is non-negotiable for verifying your projected income. Never, ever take the seller's rent roll at face value.
Investor Tip: When you're looking at comps, the story is always between the lines. A slightly cheaper property might be on a noisy main road, while a more expensive one could be in a top-rated school district. Context is everything.
A Real-World Example: The Deal-Killing Discovery
I know an investor who was analyzing a four-plex that looked perfect on paper. The numbers worked, the building was solid, and the seller’s rent numbers seemed plausible.
But then he did his homework. He drove the neighborhood and spotted a sign on a large, empty lot two blocks away that he hadn't seen online: "Future Home of The Aspire Luxury Apartments – 150 Units."
That one discovery changed the entire equation. The sudden influx of 150 brand-new units would flood the local market, cranking up vacancy rates for older properties like his. He'd be stuck lowering rents or offering huge concessions just to stay competitive. He walked away from the deal—a smart move that his financial spreadsheet alone would have never told him to make.
Sales Comps vs. Rental Comps: A Quick Comparison
It's crucial to understand how these two tools work together to give you a complete picture.
| Analysis Type | Primary Goal | Key Data Points to Compare | Where to Find Data |
|---|---|---|---|
| Sales Comps | To determine the fair market value and avoid overpaying. | Sold price, date of sale, square footage, bed/bath count, lot size, age, condition. | MLS (via an agent), public records, Zillow/Redfin "Recently Sold" filters. |
| Rental Comps | To verify projected rental income and understand local demand. | Monthly rent, lease terms, days on market, amenities, pet policies, utilities included. | Zillow, Apartments.com, Rentometer, Facebook Marketplace, calling local property managers. |
Skipping your market and competition analysis is one of the fastest ways to lose your shirt in real estate. The property's numbers tell you what is, but the market's numbers tell you what will be.
Your Due Diligence and Risk Mitigation Checklist

So, the numbers look solid and the market seems right. Now it's time to switch gears from analysis to verification. This is what we call the due diligence period—your contractually agreed-upon window to put the property under a microscope and make sure everything the seller claimed is actually true.
Think of it as the "trust, but verify" phase of your real estate investment property analysis. I've seen promising deals turn into financial nightmares simply because this step was rushed or skipped altogether. This is your last, best chance to find hidden problems, renegotiate, or walk away with your money still in your pocket.
The Physical Inspection Deep Dive
First things first: hire a qualified, independent home inspector. Don't use the one the seller's agent recommends. You want someone who works for you, and ideally, someone experienced with investment properties. They're trained to spot issues you'd walk right past.
A standard inspection is a good start, but for an investment, you have to go deeper. The real killers are the "big ticket" items, because replacing one of them can eat up years of your projected cash flow.
- Roofing Specialist: You need a clear, honest assessment of the roof's remaining life. A surprise replacement can easily set you back $10,000 to $20,000, or even more.
- HVAC Technician: Get the furnace and A/C systems serviced and evaluated. Knowing their age and condition is crucial for budgeting future capital expenses.
- Foundation Expert: Look for any signs of cracking, settling, or water damage that could point to serious, expensive structural issues.
- Sewer Scope: This is non-negotiable for me. A camera inspection of the main sewer line can find tree roots or cracks that could turn into a five-figure plumbing disaster.
Financial and Legal Verification
While the inspectors are crawling through the attic, you need to be buried in paperwork. This is where you audit the numbers and uncover any legal skeletons hiding in the closet. Never take the seller's pro forma or rent roll at face value.
I was once looking at a small multi-family building where the numbers on paper were fantastic. During due diligence, I demanded to see the actual tenant leases and their payment histories. It turned out two of the four tenants were a full three months behind on rent—a critical detail the seller had conveniently "forgotten" to mention. That discovery completely tanked the deal's economics.
That experience hammered home the need for a meticulous checklist. For a more comprehensive breakdown, check out our complete real estate due diligence checklist.
Key Document Review Checklist
| Document Category | What to Verify | Why It Matters |
|---|---|---|
| Lease Agreements | Scrutinize every current lease. Confirm rent amounts, end dates, security deposit details, and any unusual clauses. | This confirms the actual income, not just what's on the rent roll, and flags potential turnover risks. |
| Rent Roll & Payment History | Get a detailed rent roll and at least 12 months of payment history for every single tenant. | This is how you spot chronically late or non-paying tenants—a massive red flag for future cash flow. |
| Expense Reports | Demand copies of utility bills, tax statements, insurance policies, and maintenance receipts for the last 24 months. | This verifies the seller's operating expenses. Sellers love to understate costs to inflate the NOI. |
| Title Report | Have a title company conduct a full title search on the property. | This uncovers liens, easements, or ownership disputes that could become your expensive legal nightmare. |
| Zoning & Permits | Call the local municipality. Confirm the property's zoning is correct for its current use and that all past work was properly permitted. | You don't want to inherit an illegal apartment or unpermitted deck that could lead to fines and tear-downs. |
The Broader Market Context
Due diligence isn't just about the property itself; it’s also your final check on the surrounding market. This is especially true for residential properties. Shifting demographics and housing affordability are powerful forces that can make or break an investment.
The "Living sector"—which covers everything from build-to-rent communities to student housing—is projected to attract US$1.4 trillion over the next five years, making it the largest real estate investment class in the world. Understanding these larger trends helps validate the long-term demand for your specific property.
In the end, due diligence is all about managing risk. Every problem you uncover—a leaky faucet, an understated insurance bill, a roof on its last legs—is a new point of negotiation. Use your findings to demand a price reduction or seller credits at closing. And if the problems are just too big? This is your chance to walk away, no harm done. A thorough process ensures you’re buying an asset, not someone else's liability.
Taking Your Analysis to the Next Level with Modern Tools
Once you’ve nailed down the fundamentals, it’s time to start thinking like the pros. The best investors I know don't just confirm that a deal works on paper today; they dig deeper to understand how it will hold up when things get messy. This is where you separate a merely good deal from a truly resilient, long-term wealth builder.
A crucial part of this is running a sensitivity analysis. Think of it as a financial stress test for your potential property. Instead of trusting a single, perfect projection, you start plugging in different numbers for your key variables to see how your returns react. What happens to your cash flow if a local employer leaves town and vacancy rates jump from 5% to 10%? How does a 1% rise in interest rates affect your ability to refinance down the road?
By building out best-case, worst-case, and most-likely scenarios, you quickly see where a deal’s weak points are. A property that only cash flows under perfect conditions is a fragile investment. You're looking for the one that stays in the green even when some of your assumptions prove to be a bit too optimistic.
Looking Ahead: Niche Opportunities and Market Trends
A truly sophisticated real estate investment property analysis means looking beyond today’s numbers and anticipating what’s next. You have to watch the major economic and technological shifts that create unique opportunities.
Take the boom in data centers, for example. The AI revolution and our world's insatiable need for data are creating explosive growth in this sector. A recent outlook from JLL projects that power demand from data centers is on track to more than double by 2030. You can dig into these global real estate trends in JLL's market analysis.
This creates a completely different kind of analysis. An investor vetting a potential data center site isn't just worried about cap rates. They have to analyze factors that are totally irrelevant to a duplex or an apartment building, such as:
- Power Grid Capacity: Can the local grid handle the massive, uninterrupted power draws?
- Fiber Optic Infrastructure: Is there enough high-speed connectivity to serve a major tech client?
- Geopolitical Stability: Is the location physically and digitally secure?
- Environmental Cooling Factors: What are the long-term costs of keeping the servers cool in that climate?
This is a perfect illustration of a critical point: as the world changes, the metrics that define a great investment change with it. The screenshot below, based on PwC research, shows just how much this particular niche has caught the eye of institutional investors.
This chart makes it clear—data centers are a leading prospect across the globe. It's a powerful reminder that our analysis has to evolve with these major technological and economic currents.
The Right Software and Calculators to Work Smarter
Let’s be honest, building a new spreadsheet from scratch for every single property you look at is a huge time sink, and it’s easy to make a costly mistake. Thankfully, we have a ton of software and online calculators that can automate the heavy lifting, letting you analyze more deals, faster, and with more confidence.
These tools are fantastic for quickly screening deals and weeding out the duds. But here's a word of caution: they are only as good as the numbers you put into them. Never, ever trust the default assumptions for things like vacancy, repairs, or management fees. Always override them with your own conservative numbers based on solid, local market research. If you're looking to streamline your workflow, checking out the best real estate investment apps is a great way to find a tool that fits your personal strategy.
Here’s a quick breakdown of the types of tools available to help you conduct a more effective real estate investment property analysis.
| Tool Type | Primary Use | Key Features | Best For |
|---|---|---|---|
| Deal Analysis Software | Comprehensive financial modeling and reporting. | Detailed pro forma projections, sensitivity analysis, IRR calculations, professional PDF reports. | Serious investors tackling complex deals like multi-family or commercial properties. |
| Online Calculators | Quick screening and basic metric calculation. | Instant calculation of Cap Rate, Cash-on-Cash Return, and estimated monthly cash flow. | Beginners or active investors who need to filter a high volume of listings quickly. |
| Property Management Suites | Operational analysis and performance tracking. | Rent collection, expense tracking, tenant screening, and financial reporting for owned properties. | Investors who self-manage and want to track the ongoing performance of their portfolio. |
Ultimately, the goal is to use this technology to make smarter, data-driven decisions. When you combine rigorous stress-testing, forward-looking trend analysis, and efficient software, your analysis becomes more than just a calculation—it becomes your strategic advantage.
Frequently Asked Questions (FAQ)
1. What’s a good cap rate for an investment property?
There's no single "good" cap rate; it's entirely market-dependent. A 4-5% cap rate might be excellent in a high-demand, low-risk city, while a 9-10% rate might be necessary to justify the risk in a smaller, less stable market. The key is to compare a property's cap rate to the average for similar properties in the same neighborhood to determine its relative value.
2. How much should I budget for repairs and maintenance?
A common rule of thumb is to budget 1-2% of the property's purchase price annually for maintenance. Another method is budgeting 5-10% of the gross rental income. However, this must be adjusted based on the property's age and condition. An older property with an aging roof and HVAC system requires a much larger repair budget than a newer build.
3. What is the single biggest mistake new investors make in property analysis?
The most common mistake is being overly optimistic. New investors often underestimate expenses (especially vacancy and capital expenditures like a new roof) and overestimate potential rental income. This leads to deals that look great on paper but lose money in reality. Always use conservative numbers and verify all assumptions with local data.
4. Should I focus on cash flow or appreciation?
For most investors, especially those starting out, cash flow is king. Positive cash flow provides a safety net to cover unexpected expenses and market downturns, ensuring you can hold the asset long-term. Appreciation is a powerful wealth-builder but is speculative. A great investment strategy aims for properties that provide reliable cash flow with the potential for future appreciation.
5. What is "analysis paralysis" and how do I avoid it?
Analysis paralysis is the state of over-analyzing potential deals to the point where you never make a decision. To avoid it, establish clear investment criteria before you start looking (e.g., minimum cash-on-cash return, specific neighborhoods, property type). When a property meets your pre-defined criteria, make an offer. The goal is to make an informed decision, not to find a mythical "perfect" deal.
6. How do I accurately estimate rental income?
Never rely solely on the seller's stated rents. Conduct your own rental market analysis by checking active listings for similar properties on sites like Zillow and Apartments.com. For the most accurate data, call local property managers and ask what comparable units are currently renting for. This gives you real-time, unbiased information.
7. What's the difference between Cap Rate and Cash-on-Cash Return?
Cap Rate measures the property's unleveraged return, assuming an all-cash purchase. It's used to compare the relative value of different properties. Cash-on-Cash Return measures the return on your actual invested cash (down payment + closing costs). It is a personal metric that tells you how hard your money is working for you, factoring in your specific financing.
8. How important is a professional property inspection?
It is absolutely critical and non-negotiable. A professional inspector identifies potentially catastrophic and expensive issues (foundation, roof, electrical, plumbing) that are invisible to an untrained eye. Skipping an inspection to save a few hundred dollars can easily cost you tens of thousands in unforeseen repairs down the line.
9. Can I do my own property analysis without software?
Yes, you can absolutely perform a thorough analysis using a spreadsheet. Understanding how to build the calculations yourself (for NOI, Cap Rate, etc.) is a fundamental skill. However, software like DealCheck can speed up the process, reduce errors, and allow you to analyze more deals efficiently.
10. How is analyzing a multi-family property different from a single-family home?
The core financial metrics are the same, but the complexity increases. With a multi-family property, you analyze multiple income streams (leases) and have larger, more varied expenses (common area utilities, landscaping, etc.). Critically, the value of larger multi-family properties (5+ units) is based primarily on the income they generate (commercial valuation), whereas single-family homes are valued based on comparable sales (residential valuation).
Ready to turn your analysis into action and start building your financial future? For more expert insights on real estate, stocks, and wealth-building strategies, explore the resources at Top Wealth Guide. Visit us at https://topwealthguide.com to continue your journey.
This article is for educational purposes only and is not financial or investment advice. Consult a professional before making financial decisions.