
Dollar cost averaging — turning market volatility from foe to friend. It’s a strategy that’s like your disciplined workout routine… it’s gonna pay off. This systematic approach lets you scoop up more stocks when prices stumble and back off when they spike.
At Top Wealth Guide, we see droves of investors amassing serious wealth using this strategy. Why? It strips the drama out of investing, leveling out those wild price swings over the long haul.
In This Guide
How Does Dollar Cost Averaging Actually Work
So here’s the scoop-dollar cost averaging. What is it? Basically, you drop the same amount of cash into the market at regular intervals-rain or shine. Picture this: you’re tossing $500 into an S&P 500 index fund every month. Market’s on a rollercoaster? Doesn’t matter. Up, down, sideways-you keep your cool and stick to the plan. This strategy means you’re snapping up more shares on the cheap when prices nosedive and fewer shares when they’re through the roof. Genius, right?
The Mathematical Reality Behind Price Averaging
Let’s dive into some number crunching-don’t pass out yet, it’s actually kinda cool. Say you’re committing $1,000 every month for five months. Month one? Shares are $50. Boom, 20 shares in your pocket. Month two rolls around, prices plunge to $40, and you grab 25 shares. Month three-they drop again to $30, so you rake in 33 shares. Month four sees a little bounce back to $45, netting you 22 shares. By month five, they’re up to $55… so you snag another 18 shares.
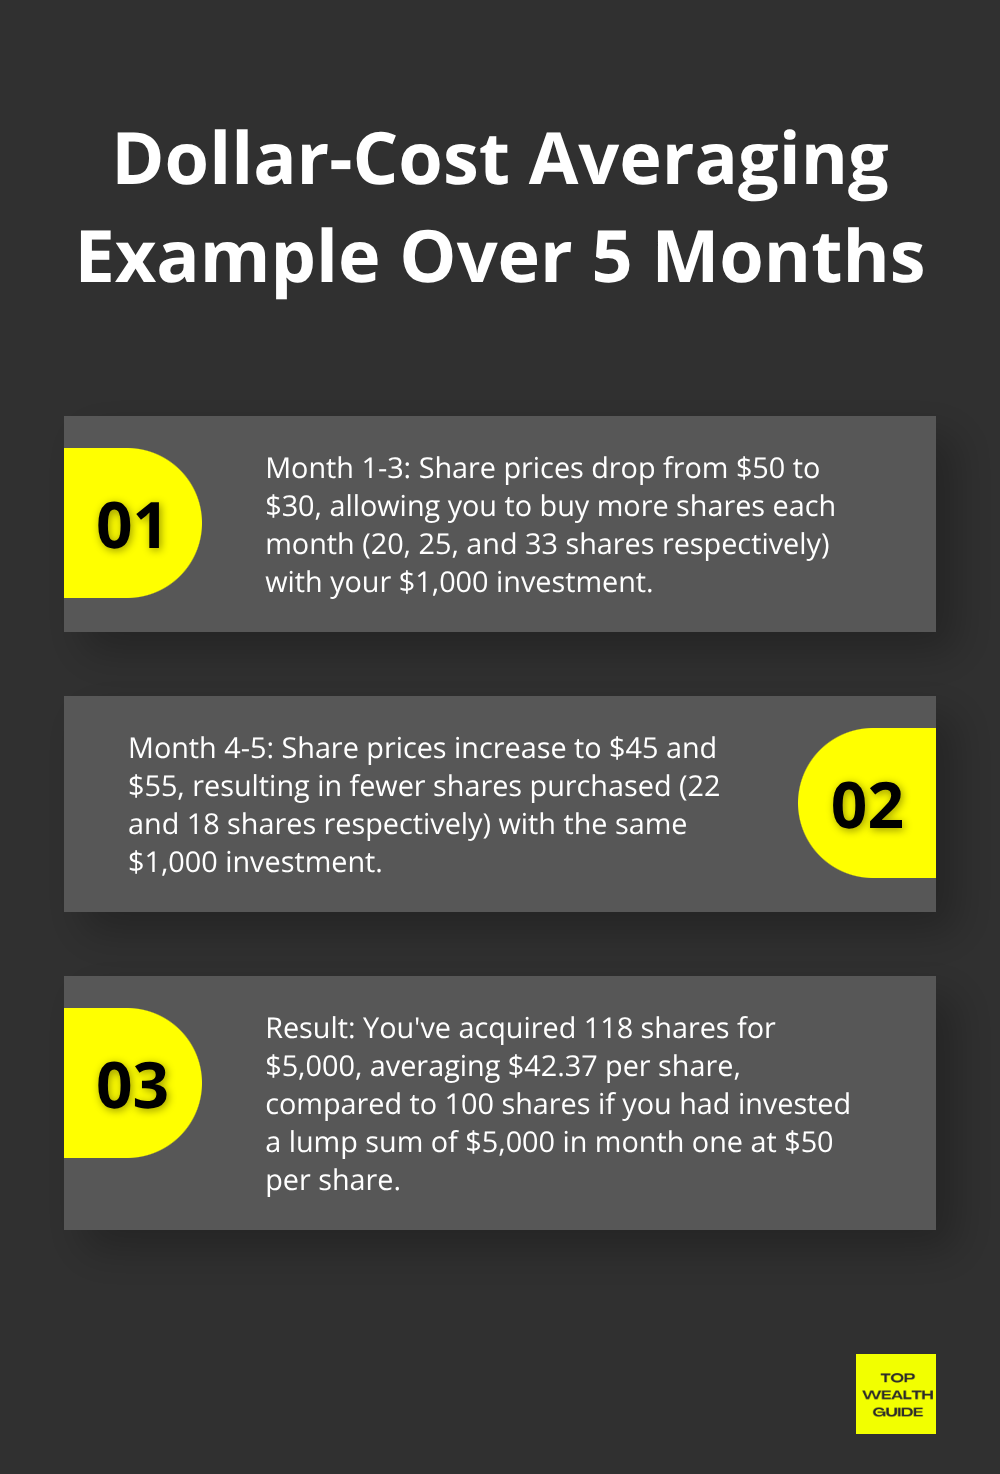
Bottom line: you’ve amassed 118 shares for a cool $5,000, averaging $42.37 a share. Compare that to dropping a lump sum of $5,000 at $50 a pop in month one-you’d only walk away with 100 shares. Dollar-cost averaging is all about slicing your buy-in, spreading it thin over time, mitigating your risk in those oh-so-fun volatile stretches.
Why Lump Sum Often Beats Dollar Cost Averaging
Now, here’s the kicker-brace yourself: lump sum investment typically comes out on top, around 68% of the time, when you stack it against dollar cost averaging. Vanguard did some serious number-crunching on 10-year periods from 1926 to 2015, and guess what? Lump sum edged out dollar cost averaging by an average of 2.3% each year.
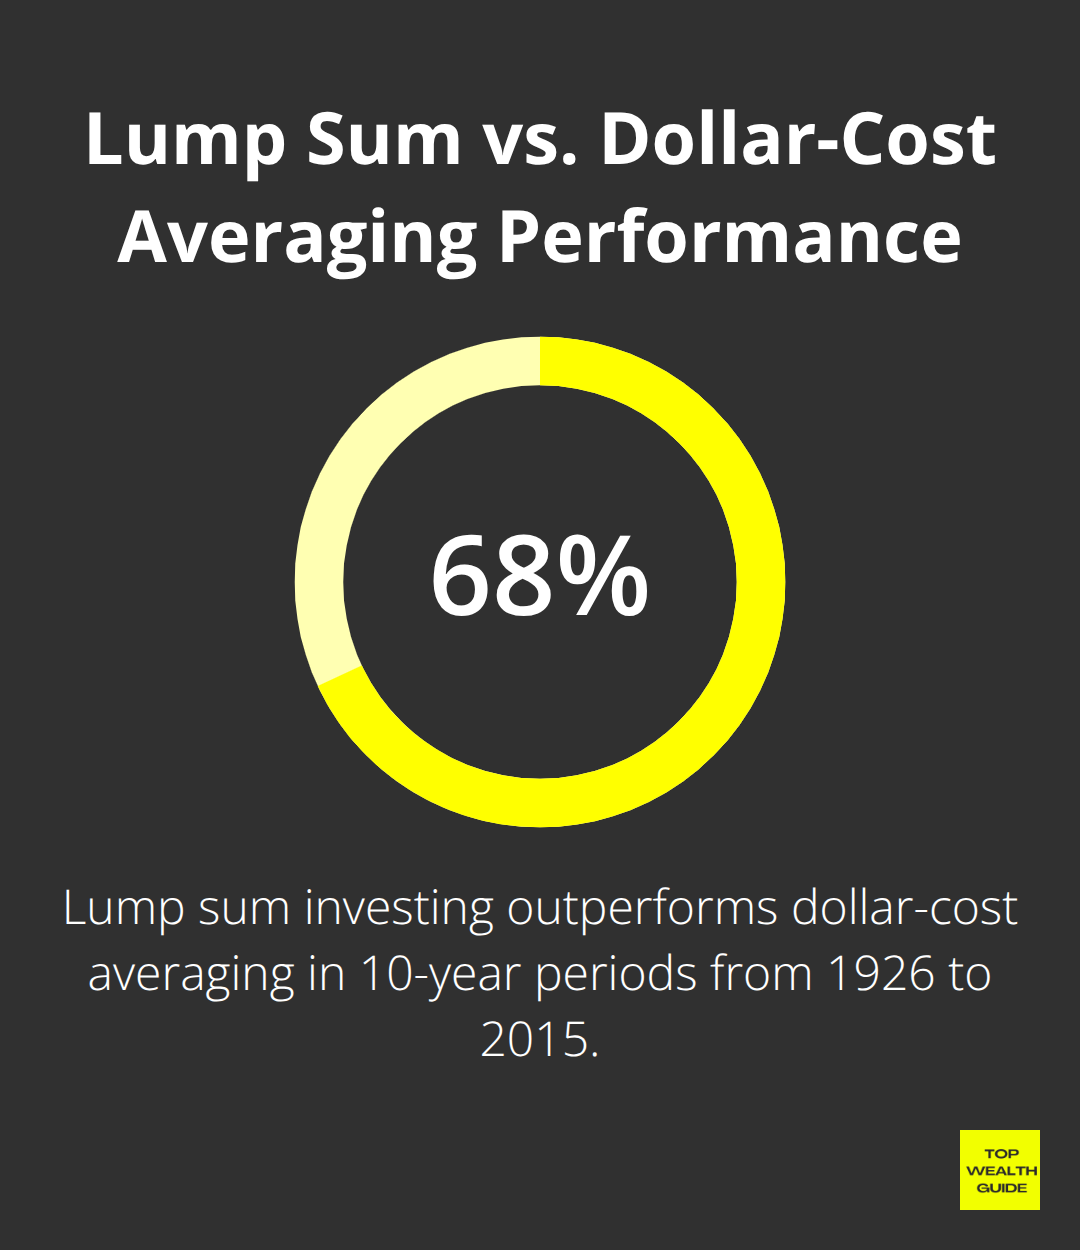
Why? Because stretching out your full investment over time can mean missing out when the market’s on the up and up. But hey, dollar cost averaging isn’t all bad. When those markets take a nosedive, it cushions the blow, saving you from a world of hurt more than a one-time lump sum drop would. So what’s the takeaway? It boils down to your risk appetite-are you in or are you out? That, not math, makes the real difference in this investment game.
Is Dollar Cost Averaging Worth the Trade-offs
Dollar cost averaging-taking market chaos and breaking it down into bite-sized monthly bits-sounds neat, but let’s face it, it doesn’t come without its baggage. So, what’s the real upside? You dodge the stress-fest of nailing perfect market timing. Picture this: Swagger over to some data from Schwab, and you’ll find even the guy investing at the worst possible moments every year still pocketed a cool 10.6% annually across two decades. Versus the 11.7% for the timing ninja. Yeah, just a 1.1% hit for tripping up every time. Not too shabby.
The Emotional Safety Net That Costs Money
Ah, dollar cost averaging-a love affair for rookie investors. It feels like putting on a cozy sweater. No all-in anxiety attacks. Fidelity spills the beans, showing folks on these systematic plans stick around way longer than those dropping hefty chunks of cash at random. But there’s a toll to this comfort cruise. Morgan Stanley crunches numbers back to 1926 and here’s the bombshell-lump sum often steals the show, outperforming dollar cost averaging.
The Hidden Opportunity Cost Problem
Here’s where dollar cost averaging sneaks in with a sly uppercut. As you drip-feed your cash into the market over the year, that dough is just chilling, earning a pathetic 0.5%. Bull markets stretching beyond your average dollar cost averaging spell? Ouch. That means you’re essentially buying pricier shares over time for the sake of some peace of mind. With the S&P 500 doing a positive tango most 12-month stretches, dollar cost averaging often equates to paying more.
When Market Psychology Beats Math
Smart money knows this dance: got the funds and a stomach for volatility? Lump sum typically takes the cake. But here’s the kicker-behavioral finance says a lot of those wannabe lump sum folks never actually take the leap. They’re chilling and waiting for perfection… that’s always a mirage. Dollar cost averaging drags you out of the indecision swamp and builds wealth through consistency- going steady instead of going big. That mental edge often trumps the math, particularly for those plagued by market jitters.
The real puzzle is: how do you craft a dollar cost averaging setup that amplifies these perks, slashing the drawbacks?
How Do You Set Up Dollar Cost Averaging the Right Way
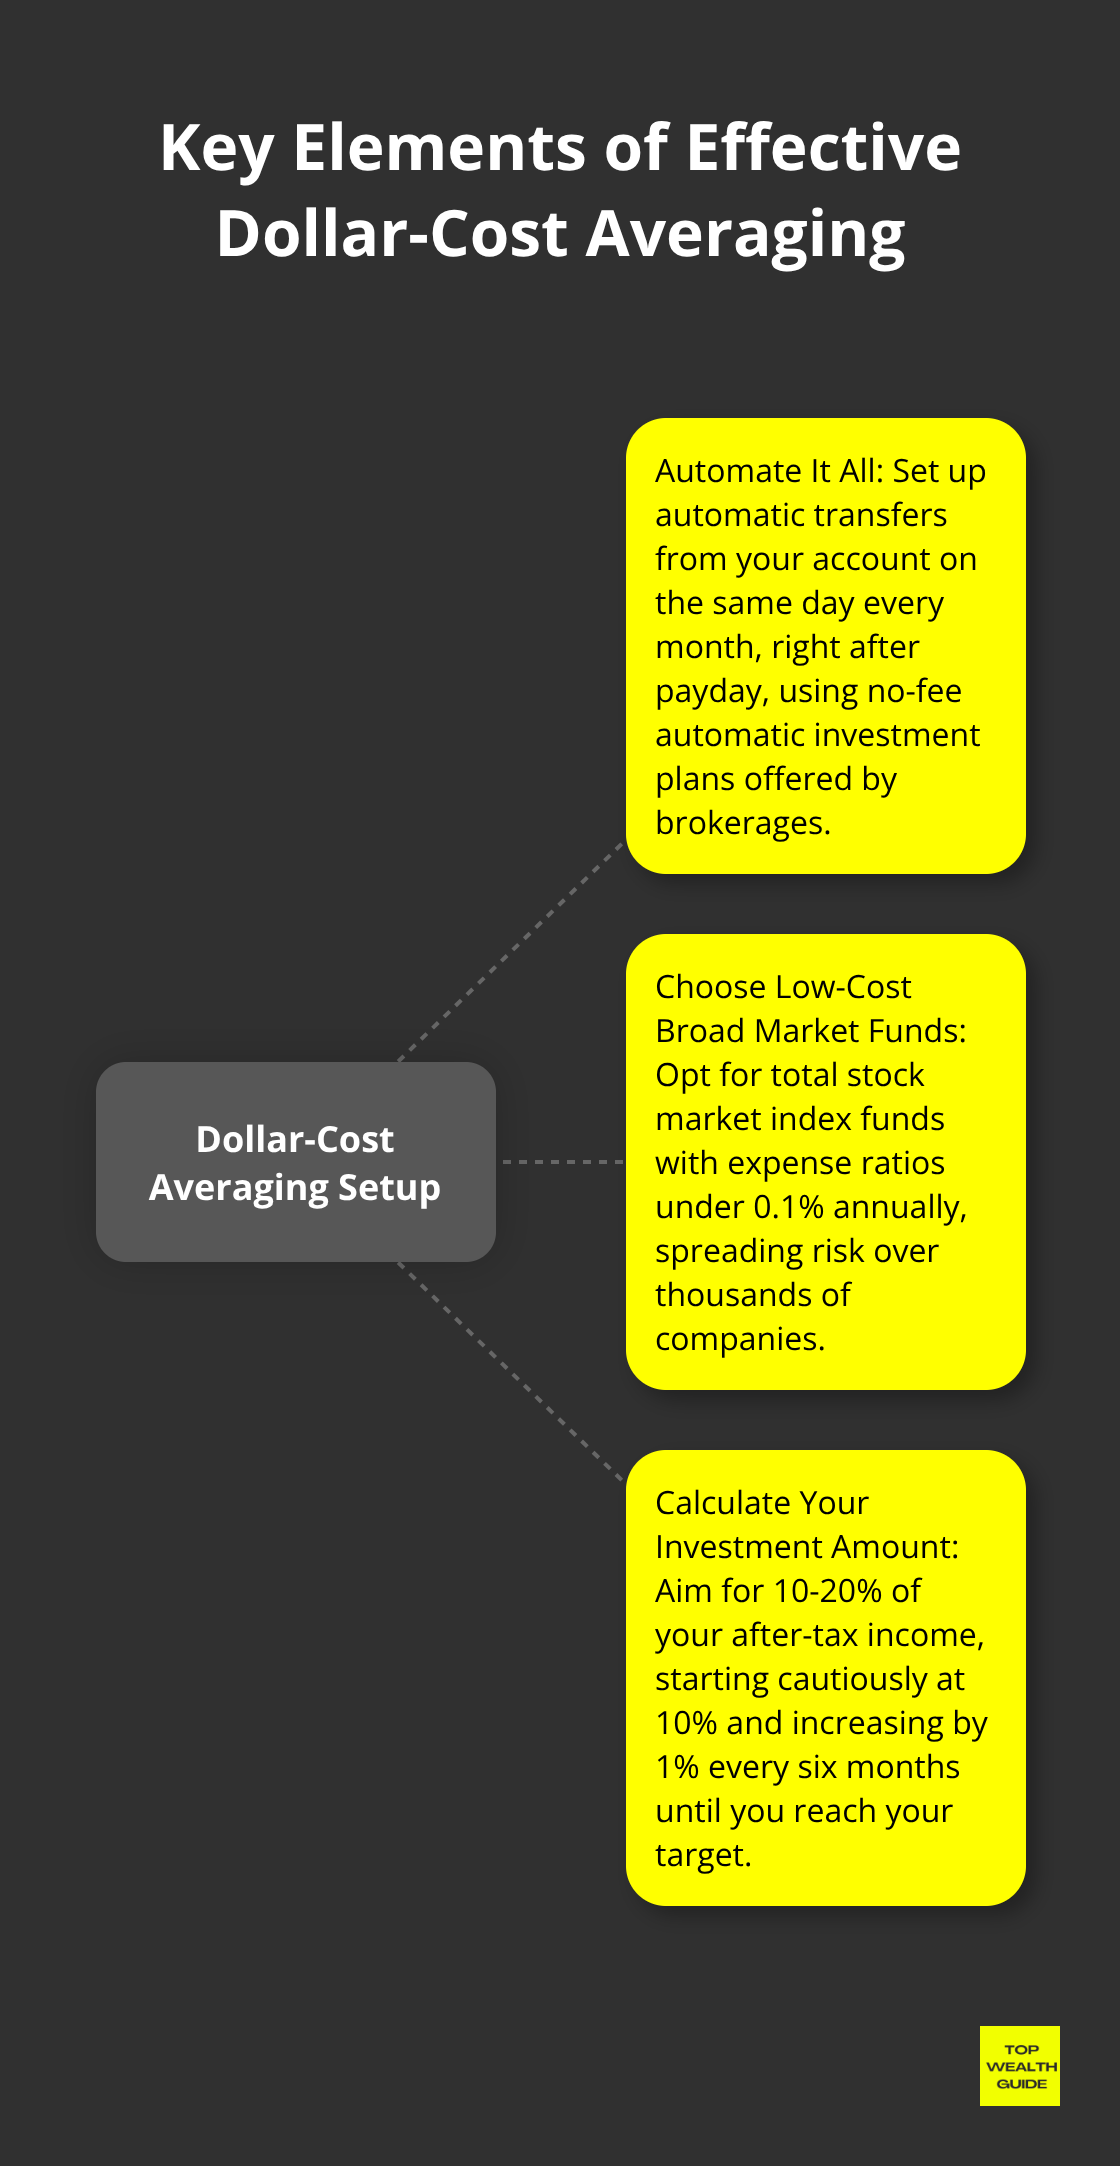
So, you want to nail dollar cost averaging? Here’s the playbook – and there are three moves you just can’t skip: automate it all, go for those low-cost broad market funds, and pin down your monthly contribution like your financial future depends on it (because, spoiler alert … it does). Start by automating through your brokerage. Think Fidelity, Schwab, Vanguard – they all offer no-fee automatic investment plans for their own funds. Set it up – transfers from your account same day every month, right after payday. This way, you’re not tempted to flake out when the market’s having a bad hair day.
Pick Total Stock Market Index Funds Over Individual Stocks
Here’s the deal – your investment vehicle is going to make or break this whole dollar cost averaging thing. Aim for total stock market index funds like FXAIX at Fidelity or VTSAX at Vanguard. These bad boys have expense ratios under 0.1% a year and spread out your risk over thousands of companies. Individual stocks? A gamble – Tesla, Apple … they can dive 50% faster than you can say “oops,” which is disastrous for your slow-and-steady game plan. Steer clear of real estate trusts and sector-specific ETFs, they just pile on concentration risk. Stick to broad exposure via index funds that track the S&P 500 or total market. It’s math, simple math: index funds have a long history of beating the pants off actively managed funds, making those low-cost index funds your best shot at consistent long-term growth.
Calculate Your Sweet Spot Investment Amount
How much should you put in each month? Aim for 10-20% of your after-tax income … but never more than you can keep up with during the lean times. Somebody taking home $5,000 after taxes should shoot for $500-$1,000 monthly. Begin cautiously at 10% and creep up by 1% every half-year till you hit your target. Round numbers like $1,000 might look pretty, but if they stretch your budget too thin – nah. $750 consistently? Way, way better than $1,000 once in a blue moon. The winners in this dollar cost averaging game keep their contributions steady for the long haul. Remember, sustainability beats bravado – every time.
Final Thoughts
Dollar cost averaging-your secret weapon against market swings. Seriously, the math doesn’t lie: even folks with the world’s worst timing still raked in 10.6% annually over two decades, just a smidge behind those mythical perfect timers. This isn’t just about making money; it’s about cutting emotion out of the equation and letting it snowball into serious wealth over time.
Get the ball rolling today: automate those monthly transfers into a rock-bottom-cost total stock market index fund. Aim for 10-20% of that post-tax cash flow. Let Fidelity, Schwab, or Vanguard handle the mechanics for free (and hey, set a number you can stick with even when times are tight-$750 on the regular trumps $1,000 now and again).
The numbers? They back patience over precision. Sure, lump sums might edge out 68% of the time historically, but dollar cost averaging nails what truly counts: getting you in the game and keeping you there. Stick with it for a couple of decades, maybe three, and watch discipline morph into millions through compound growth. We at Top Wealth Guide stand by this method-it’s tailor-made for folks looking to amass hefty portfolios without the stress of trying to outsmart the market.
1 Comment
Pingback: 10 Proven Wealth Management Strategies for 2025