
When you hear investors talk about performance, the term “average rate of return” comes up a lot. At its core, it’s a simple but powerful metric that shows you the typical return you can expect from an investment over a set period.
Think of it as smoothing out the bumps. Investments rarely grow in a straight line; there are good years and bad years. The average rate of return cuts through that volatility, giving you a single, digestible percentage that sums up an asset’s historical track record. This number is your best friend when comparing different investment options or setting realistic financial goals.
In This Guide
What Is the Average Rate of Return in Simple Terms

Imagine a gardener tracking how tall their prize-winning tomato plants grow over five years. Some seasons are sunny and perfect, leading to huge plants. Others are dry and disappointing. Instead of fixating on one amazing year or one terrible one, the gardener would calculate the average growth to get a true sense of the plant’s long-term potential.
Investing works the same way. Your portfolio might soar 20% one year, only to drop 10% the next. The average rate of return helps you ignore this short-term noise and see the bigger picture. It’s a tool to prevent knee-jerk reactions to market swings and focus on the overall performance trend.
Why This Metric Is a Core Concept
If you’re serious about building wealth, getting a handle on the average rate of return is non-negotiable. It’s a universal yardstick for measuring and comparing the performance of practically any asset, whether it’s stocks, bonds, or real estate. For those just starting out, mastering this concept is a crucial first step. If you’re looking to build a strong foundation, you can dive deeper into our guides on investing basics.
Here’s a quick breakdown of what the average rate of return is and why it’s so important for you.
Quick Guide to Average Rate of Return
| Concept | Why It Matters for You |
|---|---|
| A Smoothed-Out Performance Figure | It turns messy, volatile yearly returns into a single, easy-to-understand number. |
| A Tool for Comparison | It lets you compare apples to apples when deciding between different funds, stocks, or other assets. |
| A Reality Check for Goal Setting | It helps you project future growth based on historical data, not just wishful thinking. |
| A Measure of Historical Success | It provides a clear snapshot of how an investment has performed over the long haul. |
Ultimately, understanding this metric is about making smarter, more informed decisions. It helps you build a more strategic and resilient investment plan by grounding your expectations in reality.
An investment’s average rate of return is like a marathon runner’s average pace. It doesn’t show the bursts of speed or the moments of struggle, but it tells you the consistent speed that got them across the finish line.
How to Calculate Your Investment Returns

Getting a handle on your portfolio’s performance really boils down to knowing how to calculate its average rate of return. It might sound a bit technical, but there are a couple of key methods that, once you understand them, tell a slightly different story about your investment’s journey.
The first way is the arithmetic mean, which is probably the one you remember from school. You just add up all the returns from each period and divide by the number of periods. It’s a fast and easy way to get a simple average.
The second method is the geometric mean. For investors, this one is far more powerful because it accounts for the magic of compounding—the way your returns build on themselves year after year. It gives you a much truer picture of how your portfolio has actually grown.
Arithmetic vs. Geometric Mean: A Real-Life Example
Let’s make this real. Imagine an investor, Sarah, who puts $1,000 into a tech mutual fund.
In the first year, the market is hot, and her investment jumps 30%. Awesome. But the next year, the market pulls back, and her investment drops by 20%. So, what was her average return?
Calculating with the Arithmetic Mean:
- First, add the returns: (30% + (-20%)) = 10%
- Then, divide by the number of years: 10% / 2 = 5%
This method tells you that Sarah’s average annual return was 5%. But wait a minute. Let’s follow the actual cash. After Year 1, her $1,000 grew to $1,300. In Year 2, that 20% loss wasn’t on her original thousand; it was on $1,300. A 20% loss on $1,300 is $260, which leaves her with $1,040. The simple average doesn’t quite match up with reality, does it?
Why the Geometric Mean Matters More
This is where the geometric mean steps in to give you a more accurate growth rate. For that same two-year rollercoaster, the geometric average rate of return is actually 1.98%. That number tells you the real compounded growth that turned her initial $1,000 into $1,040.
The geometric mean is the investor’s true north. It shows the steady, consistent annual return you would have needed to achieve the same final result, effectively smoothing out the real-world ups and downs caused by volatility.
Here’s a quick comparison table to break down when to use each one:
| Calculation Method | Best Use Case | What It Reveals | Real-Life Implication |
|---|---|---|---|
| Arithmetic Mean | Quick estimates or academic models. | A simple, uncompounded average of returns. | Can be misleading and overstate actual growth. |
| Geometric Mean | Accurately measuring long-term investment performance. | The actual compounded growth rate of your money over time. | Provides a true picture of how your wealth has grown. |
While the arithmetic mean has its place for a quick look, the geometric mean provides a much more honest assessment of how your portfolio is actually performing. If you want to dive in without doing all the math by hand, exploring different wealth tools and calculators can make it a breeze and give you a clearer picture of your financial progress.
Unpacking Historical Returns for Major Asset Classes
Knowing what an “average rate of return” is in theory is one thing. Seeing how it actually plays out in the real world with your money is something else entirely. This is where looking back at historical data becomes so powerful. It gives us a solid benchmark for setting realistic expectations for different types of investments, or what we call asset classes.
Think of each asset class as having its own distinct personality. Each one comes with a unique risk and return profile that has been shaped by decades of economic ups and downs.
Stocks: The Long-Term Growth Leader
For most people trying to build wealth, the stock market is the main engine. We often look to the S&P 500—an index of 500 of the biggest U.S. companies—as a stand-in for the market as a whole. Over the long haul, it has proven incredibly resilient, powering through everything from brutal recessions to massive economic booms.
Historically, stocks (or equities) have consistently delivered the highest average returns compared to other major asset classes. But there’s a catch: this higher reward comes with higher volatility. The value of your stocks can swing wildly in the short term. For investors who can stick it out for the long run, though, that bumpy ride has almost always been worth it.
This chart drives the point home, showing the performance gap between stocks, bonds, and cash over a 10-year period. You can really see the reward you get for taking on more risk.
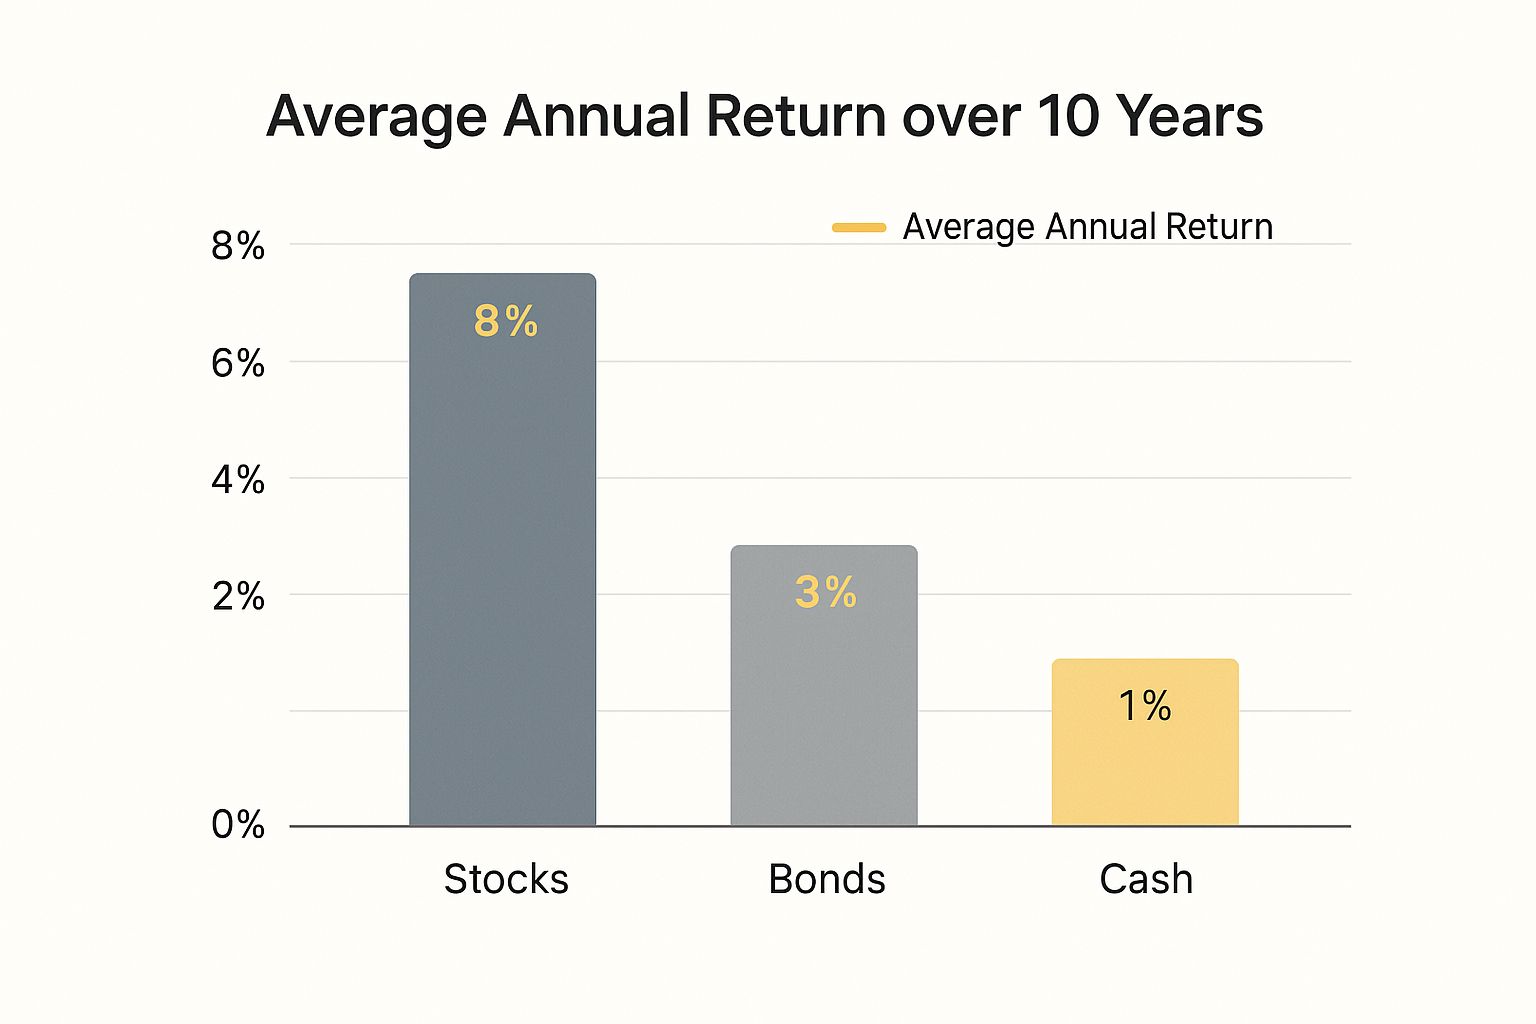
It’s pretty clear from this visual why stocks form the foundation of so many growth-focused portfolios. They just leave less risky assets in the dust over time.
When you dig into the numbers, this isn’t just a recent trend. Over the last 150 years, the U.S. stock market’s historical average annual return is about 9.35%, assuming you reinvested all your dividends. Even after you factor in inflation, the real return is a healthy 6.94%. That shows the market’s incredible power to grow your wealth faster than the cost of living rises.
Comparing Asset Class Performance
While stocks might be the star of the show, a truly smart portfolio usually includes other assets to smooth out the ride. Understanding how these other classes have performed gives you the context you need to build a strategy that fits your own goals and comfort level with risk.
For example, many investors wonder if real estate is a good investment and how it stacks up against stocks. It’s a great question to ask when building a diversified plan.
To help put it all in perspective, here’s a quick look at the typical risk-and-reward spectrum across the most common asset classes.
Historical Average Annual Returns by Asset Class
This table gives a high-level view of what you might expect from different investments over the long term, illustrating the classic trade-off between risk and potential reward.
| Asset Class | Historical Average Annual Return | Typical Risk Level | Investor Profile |
|---|---|---|---|
| Stocks (Equities) | 8% – 10% | High | Growth-oriented, long-term horizon. |
| Real Estate | 4% – 8% | Medium to High | Seeks income, potential appreciation, less liquidity. |
| Corporate Bonds | 3% – 5% | Medium | Seeks stable income with moderate risk. |
| Government Bonds | 2% – 4% | Low | Conservative, prioritizes capital preservation. |
| Cash Equivalents | 0.5% – 2% | Very Low | Risk-averse, needs immediate access to funds. |
The takeaway here is simple but crucial. Assets with higher potential returns, like stocks, come with more risk. On the flip side, safer bets like government bonds offer lower returns but give your portfolio stability, which is especially valuable when the market gets rocky. This fundamental trade-off is the bedrock of modern investing.
Long-term averages can feel a bit abstract, and they certainly don’t capture what it’s like to live through the market’s day-to-day chaos. The average rate of return is a smoothed-out, reassuring number, but the actual journey to get there is almost always a bumpy one. That’s volatility in a nutshell.
Those gut-wrenching swings are unsettling, but they’re a completely normal part of how markets work. It’s like sailing through a storm to reach a calm harbor—the trick is not to abandon ship when the waves get high. Sharp downturns are often followed by powerful rebounds, and panicking can lock in losses right before a recovery.
What History Tells Us About Market Swings
History is our best teacher when it comes to riding out volatility. The market has been through it all—recessions, wars, tech bubbles, you name it. And every single time, it has eventually recovered and climbed to new heights. Grasping this simple fact is key to setting realistic expectations for your own portfolio.
The numbers don’t lie. Looking at data from 1928 through 2024, the U.S. stock market has delivered incredible highs and terrifying lows. During the Great Depression in 1931, for instance, the market cratered by a staggering 43.84%. It’s a stark reminder of the risks involved if your time horizon is too short. You can dig into decades of this data from NYU Stern to see the patterns for yourself.
“The stock market is a device for transferring money from the impatient to the patient.” – Warren Buffett
This classic Buffett quote says it all. The goal isn’t to perfectly time the market or avoid the storms altogether. It’s about building an investment strategy that’s sturdy enough to sail right through them.
Real-Life Example: Two Investors, One Market Crash
Let’s compare two fictional investors, Alex and Ben, during the 2008 financial crisis. Both start with $100,000.
| Investor | Action During 2008 Crash | Outcome by 2013 |
|---|---|---|
| Alex (The Patient Investor) | Stayed invested, continued to buy stocks at lower prices. | Portfolio recovered and grew significantly past its pre-crash high. |
| Ben (The Panicked Investor) | Sold all his stocks near the bottom, locking in losses. | Missed the powerful market rebound and was left far behind. |
This simple scenario shows that how you react to volatility has a much bigger impact on your long-term average rate of return than the volatility itself.
Strategies to Weather the Storm
So, how do you keep a level head when the market is going haywire? It all comes down to building a portfolio that’s designed to withstand the pressure. That usually means a smart mix of different investments and a focus on quality.
Here are a couple of core principles for managing volatility:
- Diversification: This is your first line of defense. Spreading your money across different asset classes, like stocks and bonds, means that when one part of your portfolio is down, another part may be up, smoothing out the ride.
- Focus on Quality: Owning shares in fundamentally strong companies can provide much-needed stability. If you’re curious, check out our guide on the top dividend stocks for steady income, as these types of companies often hold up better during tough times.
In the end, accepting volatility as a feature, not a bug, is the name of the game. Stay disciplined, keep your eyes on your long-term goals, and you’ll be in a much better position to capture the powerful growth that the average rate of return promises over time.
Comparing Recent Performance to Historical Averages
Historical averages give us a reliable compass for long-term investing, but it’s just as important to see how the recent market stacks up against those benchmarks. The last decade has been a fascinating—and often wild—ride for investors, showing off both incredible growth and sharp, sudden downturns.
Comparing the two helps ground our expectations and reminds us of the value of a disciplined strategy.
Periods of amazing growth, where returns blow past the historical norm, can make investors feel invincible. But history has a funny way of reminding us that what goes up must eventually come down, or at least level off. This is a classic concept called reversion to the mean, which just means that asset prices and returns tend to drift back toward their long-term averages over time.
A Tale of Two Decades
Let’s take a look at the S&P 500. Over the past decade, it has largely outperformed its long-term historical average. The annualized return ending in 2024 was about 13.3% with dividends, a full four percentage points higher than its historical average of roughly 9.3%.
This stretch saw some stunning gains, like the 26.3% jump in 2023, but it wasn’t a one-way street. The market also took a nosedive with a nearly 18% loss in 2022. You can get more details on what’s been driving these recent stock market returns on Business Insider.
This back-and-forth highlights a critical lesson about the average rate of return—it’s designed to smooth out the extreme ups and downs. Chasing monster short-term performance can be a dangerous game because periods of massive gains are often followed by corrections.
Large-Cap vs. Small-Cap Performance
Different corners of the market don’t always move in lockstep. While big companies in indexes like the S&P 500 have soared, smaller companies have faced a different set of challenges. The table below shows the kind of performance differences you might see.
| Market Segment | Recent Performance Trend (10-Year) | Historical Behavior | Key Takeaway |
|---|---|---|---|
| Large-Cap (S&P 500) | Strong outperformance | Generally stable growth with volatility | Prone to mean reversion after exceptional runs. |
| Small-Cap (Russell 2000) | More moderate or lagging returns | Higher volatility, potential for explosive growth | Can underperform in some cycles but lead in others. |
This comparison really drives home why diversification is so vital. If you pile all your money into last year’s winners, you could leave your portfolio exposed. A balanced approach that includes a mix of different assets and company sizes is built to be much more resilient. If you’re looking to build a portfolio for the long haul, you might be interested in our guide on the best long-term stocks for sustainable growth.
The key isn’t to predict the next hot streak but to build a portfolio that can withstand market cycles. High-flying recent returns should be seen with caution, not as a new permanent standard.
At the end of the day, using historical averages as your North Star helps you maintain perspective. It’s a constant reminder to stick to your long-term plan instead of getting swept up in the market’s latest mood swing.
Frequently Asked Questions
https://www.youtube.com/embed/O-wq-C-52NY
1. What is considered a good average rate of return?
A “good” return depends entirely on the investment’s risk. For the U.S. stock market (like the S&P 500), the historical average is around 8-10% annually. For safer assets like government bonds, 2-4% might be considered good. The key is to compare the return to the risk you’re taking.
2. How does inflation affect my investment returns?
Inflation reduces the purchasing power of your money. To find your “real” rate of return, you subtract the inflation rate from your investment return. If your portfolio grows by 8% and inflation is 3%, your real return is only 5%.
3. What is the difference between average rate of return and CAGR?
The average rate of return (arithmetic mean) is a simple average of yearly returns. The Compound Annual Growth Rate (CAGR), or geometric mean, is more accurate for investors because it shows the actual compounded growth of your investment over time, accounting for volatility.
4. Why is my portfolio’s return different from the S&P 500?
Several factors can cause this. You might be diversified into other assets (like bonds or international stocks) that performed differently. High investment fees, holding too much cash, or owning stocks that underperformed the market leaders can also lead to different results.
5. What is a realistic rate of return for retirement planning?
For long-term planning, using a conservative estimate is wise. Many financial planners use an average rate of return of 6-7% for a diversified stock and bond portfolio. This figure often accounts for inflation and fees, providing a more realistic projection for future growth.
6. Can I lose money even if the average return is positive?
Yes. This happens because of volatility. If an investment gains 50% one year and loses 40% the next, the simple average is a positive 5%. However, you would have actually lost money on your initial investment. This is why the geometric mean (CAGR) is a more useful metric.
7. How often should I check my investment returns?
While it’s tempting to check daily, it often leads to emotional decisions. Reviewing your portfolio’s performance quarterly or annually is a much healthier approach that keeps you focused on your long-term goals rather than short-term market noise.
8. Is a higher rate of return always better?
Not necessarily. Extremely high returns are almost always linked to extremely high risk. A sustainable, risk-adjusted return that aligns with your financial plan is far better than chasing a high-flying number that could lead to significant losses.
9. What role do fees play in my overall return?
Fees are a direct drag on your returns. A 1% management fee might sound small, but over decades, compounding means it can consume a massive portion of your potential gains—sometimes hundreds of thousands of dollars. Always aim for low-cost investments.
10. How can I improve my average rate of return?
You can work to improve returns by staying invested for the long term, maintaining a diversified portfolio, keeping investment costs low, and periodically rebalancing your assets to ensure they align with your risk tolerance and goals.
At Top Wealth Guide, we provide the insights and strategies you need to build and manage your wealth effectively. Learn more on our website.
1 Comment
Pingback: Should I Sell Stocks to Pay Off Debt? A Strategic Guide