
Calculating your return on investment boils down to one simple question: how much did you make compared to how much you spent?
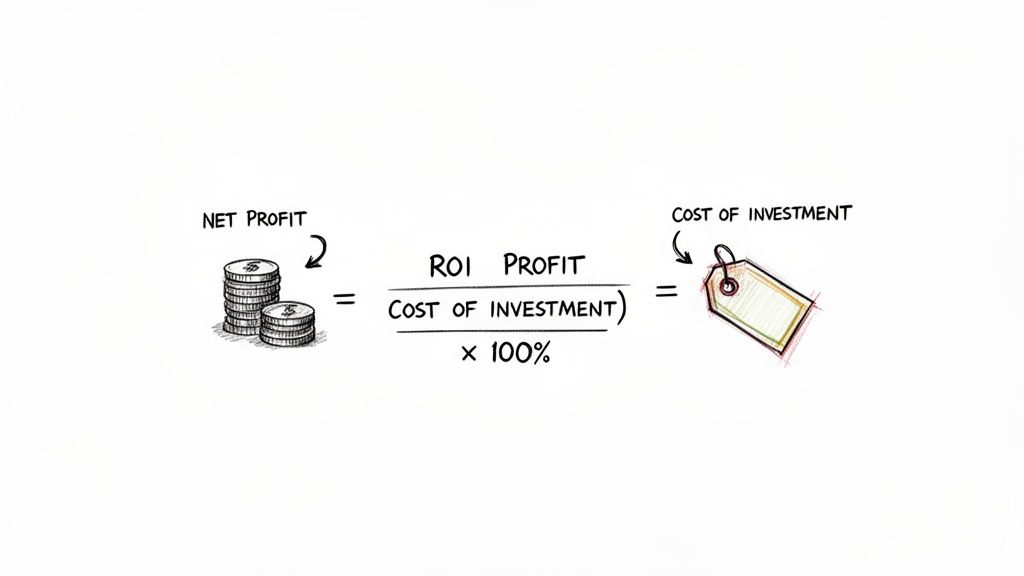
The formula is straightforward: take your net profit, divide it by the total cost of your investment, and multiply that number by 100 to express it as a percentage. This single figure is one of the most powerful tools in your arsenal, telling you exactly how hard your money is working for you.
In This Guide
- 1 Your Quick Guide To Calculating Investment Returns
- 2 Moving Beyond the Basic ROI Formula
- 3 Getting Your Hands Dirty: ROI in Real-World Scenarios
- 4 Beyond the Basics: Advanced ROI Metrics for a Clearer Picture
- 5 Common ROI Mistakes and How to Avoid Them
- 6 Frequently Asked Questions (FAQ)
- 6.1 1. What is considered a good ROI?
- 6.2 2. Can ROI be negative?
- 6.3 3. How does ROI differ from profit?
- 6.4 4. How do I calculate ROI if I invest more money over time?
- 6.5 5. Why is annualizing my ROI so important?
- 6.6 6. Should I include taxes and fees in my ROI calculation?
- 6.7 7. What is the difference between ROI and ROE?
- 6.8 8. How does inflation affect my real ROI?
- 6.9 9. Is a high ROI always a good thing?
- 6.10 10. What other metrics should I use besides ROI?
Your Quick Guide To Calculating Investment Returns
Before we get into the weeds with more complex scenarios, let’s make sure we’ve mastered the fundamentals. Think of the basic ROI formula as the foundation for every investment analysis you'll ever do. It’s your starting block.
The classic formula is: ROI = (Net Profit / Total Investment) x 100.
This simple calculation is so powerful because it gives you a universal benchmark. For example, history tells us the S&P 500 has delivered an average rate of return of around 8-10% annually over the long term. This gives you a baseline to measure your own investments against. Even after a catastrophic year like 2008, when the market plummeted -37%, savvy investors who understood the long game saw a 26.5% rebound just one year later. It puts things in perspective.
Breaking Down the ROI Formula
To use the formula correctly, you need to be absolutely clear on what each part means. Let's look at the variables you’ll be working with. Here's a quick summary to help you grasp the concept in seconds.
| Component | What It Means for You | Quick Example |
|---|---|---|
| Net Profit | This is the pure gain from your investment—the money you actually made after all is said and done. | You sell a stock for $1,200 that you bought for $1,000. Your net profit is $200. |
| Cost of Investment | This is the total cash you put in, including the purchase price, fees, commissions, or renovation costs. | You bought the stock for $1,000 and paid a $10 commission. Your total cost is $1,010. |
It’s crucial to get these numbers right for an accurate ROI. Once you're comfortable with this, you can start digging deeper into things like how different assets perform.
My Two Cents: ROI isn't just about how much profit you make; it’s about the efficiency of that profit. A $1,000 gain on a $2,000 investment (50% ROI) is a home run. That same $1,000 gain on a $20,000 investment (5% ROI) is a completely different story.
This simple calculation is the bedrock for understanding your portfolio’s performance. In the sections that follow, we'll build on this foundation with real-world examples and more advanced formulas to give you an even clearer picture.
Moving Beyond the Basic ROI Formula
The simple ROI formula is a fantastic starting point. It gives you a quick, back-of-the-napkin sketch of how an investment performed. But to make genuinely smart decisions, you have to dig deeper. Real-world investing is never quite that clean—hidden costs and the simple passage of time can completely change what you actually walk away with.
Let’s bring this to life with a common scenario. Imagine you bought 100 shares of a popular tech company, let's call it "Innovate Corp," at $150 per share. That's an initial investment of $15,000. Two years later, the stock is flying high at $220 per share, so you sell, pulling in $22,000.
Using the basic formula, your net profit is a cool $7,000 ($22,000 – $15,000). The ROI would be ($7,000 / $15,000) x 100, which comes out to 46.7%. That looks amazing on paper, but it isn't the whole truth.
Accounting for All Costs with Net ROI
That first calculation glosses over the small but mighty costs that inevitably eat into your profits. This is where Net ROI becomes your best friend. It paints a much more realistic picture by forcing you to account for all those pesky transaction-related expenses.
These costs almost always include things like:
- Brokerage Fees: The commission you pay your broker to place the buy and sell orders.
- Taxes: Capital gains taxes levied on your profit.
- Other Expenses: Any other random fees tied to the transaction.
Let's revisit our Innovate Corp example and add some real-world friction. Suppose you paid a $10 brokerage fee to buy the shares and another $10 fee to sell them. On top of that, your profit is subject to a 15% capital gains tax.
First, let's tally up the total costs:
- Initial Purchase: $15,000
- Brokerage Fees: $10 (buy) + $10 (sell) = $20
- Capital Gains Tax: 15% of your $7,000 profit = $1,050
- Total Investment Cost: $15,000 + $20 + $1,050 = $16,070
Now, we can find our true net profit:
- Final Sale Value: $22,000
- Total Costs (including tax): $16,070
- True Net Profit: $22,000 – $16,070 = $5,930
Using these more honest numbers, your Net ROI is ($5,930 / $15,020*) x 100 = 39.5%. That's a huge drop from the initial 46.7% and, more importantly, it reflects the actual money that hits your bank account.
Note: When calculating Net ROI, the 'Cost of Investment' in the denominator usually includes the initial outlay and direct fees, but not the taxes on the gain. So, the denominator here is $15,020 ($15,000 + $20).
Comparing Investments with Annualized ROI
Another massive factor the basic formula ignores is the holding period. A 30% return over three years is a very different beast from a 15% return in one year. To properly compare investments you've held for different lengths of time, you absolutely must use the Annualized ROI. This formula standardizes your total return into an equivalent yearly rate.
The Annualized ROI formula is your key to making apples-to-apples comparisons. It reveals which investment is truly working harder for your money on a yearly basis.
The formula looks a little intimidating at first glance, but it's really just a few simple steps:
Annualized ROI = [ (1 + ROI) ^ (1 / n) ] – 1
Here's what that means:
- ROI is your total return written as a decimal (so, 39.5% becomes 0.395).
- n is the number of years you held the investment.
Let's apply this to our Innovate Corp investment, which we held for two years:
- First, calculate (1 + ROI): 1 + 0.395 = 1.395
- Next, calculate (1 / n): 1 / 2 = 0.5
- Now, raise the first result to the power of the second: 1.395 ^ 0.5 = 1.181
- Finally, subtract 1: 1.181 – 1 = 0.181
- Convert back to a percentage: 0.181 x 100 = 18.1%
Your Annualized ROI is 18.1%. This tells you that your investment generated an average return of 18.1% each year. All of a sudden, that other investment with a 15% return in one year doesn't look quite as good, does it?
Key ROI Formula Variations: A Comparison Table
Knowing which formula to grab from your toolkit is what separates a novice from a seasoned investor. Here’s a quick breakdown to help you choose the right tool for the job.
| Formula Type | When to Use It | Key Consideration | Real-World Example |
|---|---|---|---|
| Basic ROI | For a quick, high-level estimate of performance without sweating the details. | Overlooks crucial costs and the time value of money. | A quick check on a stock's price change from buy to sell. |
| Net ROI | When you need a realistic measure of your take-home profit after all expenses. | Absolutely essential for understanding your true profitability. | Calculating your profit on a house flip after realtor fees and taxes. |
| Annualized ROI | To fairly compare investments that have been held for different time periods. | The gold standard for comparing performance across your portfolio. | Deciding if a 3-year real estate deal was better than a 1-year stock investment. |
Of course, none of these calculations account for the silent portfolio killer: inflation. To get an even more precise picture of your success, you'll want to learn how to calculate real investment returns after inflation, which reveals the true growth of your purchasing power. Mastering these nuanced calculations is what elevates you from amateur guesswork to professional analysis, empowering you to make much, much smarter financial decisions.
Getting Your Hands Dirty: ROI in Real-World Scenarios
The theory behind ROI is simple enough, but where the rubber really meets the road is applying it to your own portfolio. Knowing how to correctly calculate your return on investment is the only way to get a clear, honest picture of how your assets are actually performing.
Let's break down what this looks like with three completely different investments. Each has its own quirks—from recurring income to one-off costs—and understanding these details is what separates a vague guess from an accurate analysis. This is where you move from a back-of-the-napkin calculation to a truly insightful metric.
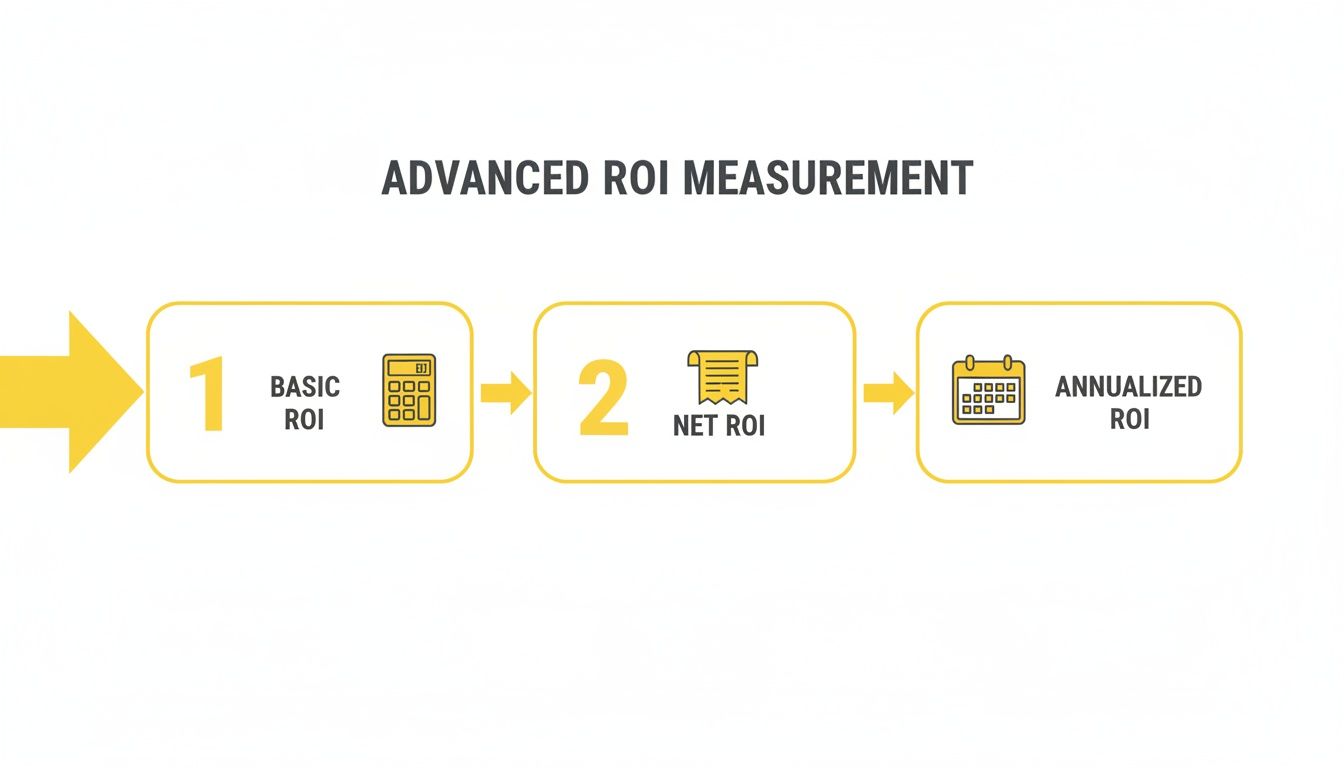
As you can see, the process gets more refined at each stage. You start with a basic ROI, then sharpen it by factoring in costs for a Net ROI, and finally, you calculate an Annualized ROI to make fair comparisons over time.
Real-Life Example: What's the ROI on an S&P 500 ETF?
For many investors, a broad market index fund is a portfolio cornerstone. But calculating its true return isn't just about the share price going up. You absolutely have to account for dividends, which are a massive driver of long-term growth.
Here’s a practical example:
- The Buy: You purchase 100 shares of an S&P 500 ETF at $300 per share, putting your total initial cost at $30,000.
- The Hold: You stick with it for 5 years.
- The Payouts: Over those five years, the fund pays out $3,000 in dividends, which you wisely reinvest.
- The Sell: You eventually sell all your shares when the price climbs to $450, cashing out for a total of $45,000.
First, let's figure out your actual Net Profit.Net Profit = (Final Sale Value + Total Dividends) - Initial InvestmentNet Profit = ($45,000 + $3,000) - $30,000 = $18,000
With that number, we can find the Total ROI.ROI = ($18,000 / $30,000) x 100 = 60%
A 60% return over five years sounds fantastic. But to see how it stacks up against, say, a real estate deal, we need to annualize it.
Annualized ROI = [(1 + 0.60)^(1/5)] - 1 = 9.86%
This 9.86% annual return is the figure you can truly compare. It's a realistic number, too—the historical average for the S&P 500 over the last century is around 10.463%. Just to put it in perspective, $50,000 invested in the early 2000s would have swelled to about $260,000 two decades later, assuming you reinvested those crucial dividends.
Real-Life Example: Unpacking the ROI on a Rental Property
Real estate is a different beast entirely. You’ve got multiple income streams and a whole host of ongoing expenses, so you need to be meticulous to get a true read on performance.
Let's say you buy a rental property.
- Purchase Price: $300,000
- Your Skin in the Game (Down Payment): $60,000 (20%)
- Upfront Costs: Closing costs and renovations add another $15,000.
- Total Initial Investment: Your total cash out-of-pocket is $60,000 + $15,000 = $75,000.
Now, let's look at the yearly numbers.
- Gross Rental Income: $2,000 a month brings in $24,000 per year.
- Annual Expenses: You’ve got mortgage interest ($10,000), property taxes ($4,000), insurance ($1,500), maintenance ($2,000), and property management ($2,400). That’s a total of $19,900 in costs.
Your Annual Net Cash Flow is what's left over.Annual Cash Flow = $24,000 - $19,900 = $4,100
This gives you a Cash-on-Cash Return of 5.47%. But that's only part of the story—it completely ignores appreciation and the equity you're building.
Fast-forward five years:
- Equity Growth: You've paid down $15,000 of your loan principal.
- Appreciation: The property is now worth $375,000, a $75,000 increase.
- Total Net Profit: (Annual Cash Flow x 5 years) + Principal Paid + Appreciation = ($20,500) + $15,000 + $75,000 = $110,500.
Now we can calculate the real Total ROI over those five years:Total ROI = ($110,500 / $75,000) x 100 = 147.3%
And the Annualized ROI:Annualized ROI = [(1 + 1.473)^(1/5)] - 1 = 19.86%
That 19.86% annualized return paints a much more attractive picture than the simple cash flow suggested. If you want to play with your own numbers, our real estate investment calculator can help you model different scenarios.
Real-Life Example: Calculating ROI on Cryptocurrency
With crypto, the calculation itself is often simpler because there are fewer variables. However, the extreme volatility makes your holding period absolutely critical. The math is the same, but the numbers can swing wildly in a short amount of time.
Let's say you invested in Ethereum (ETH).
- The Buy: You purchase 2 ETH when the price is $1,500 each, for a cost of $3,000.
- The Fees: The exchange charges a $50 transaction fee.
- Total Cost of Investment: $3,000 + $50 = $3,050.
- The Hold: You keep it for 18 months (1.5 years).
- The Sell: ETH skyrockets to $4,000. You sell your 2 ETH for $8,000, paying another $50 fee.
Your Net Proceeds from that sale are $8,000 - $50 = $7,950.
So, your Net Profit is:Net Profit = $7,950 - $3,050 = $4,900
The Total ROI comes out to:ROI = ($4,900 / $3,050) x 100 = 160.7%
To put that incredible gain into perspective, let's find the Annualized ROI:Annualized ROI = [(1 + 1.607)^(1/1.5)] - 1 = 111.9%
This example shows just how high the returns can be, but it also highlights why annualizing is so important for contextualizing those rapid gains.
Comparison Table: How ROI Calculations Differ Across Asset Classes
Calculating ROI isn't a one-size-fits-all process. The variables you need to track are unique to each asset class, which is a crucial point many investors miss. This table breaks down the key differences you need to be aware of.
| Key Factor | Stocks (e.g., ETF) | Real Estate (Rental) | Cryptocurrency |
|---|---|---|---|
| Primary Gain | Price appreciation | Price appreciation, rental income, equity | Price appreciation |
| Additional Income | Dividends | Monthly rent, other fees (laundry, parking) | Staking rewards, airdrops |
| Initial Costs | Brokerage fees | Down payment, closing costs, renovation costs | Exchange fees, network (gas) fees |
| Ongoing Costs | Expense ratios | Mortgage interest, taxes, insurance, maintenance | None (unless staking) |
| Sale Costs | Brokerage fees | Agent commissions, closing costs, capital gains tax | Exchange fees, network fees, capital gains tax |
Understanding these nuances is essential. If you overlook dividends in stocks, ongoing expenses in real estate, or transaction fees in crypto, you'll end up with a skewed and inaccurate picture of your actual returns.
The Big Takeaway: The basic ROI formula is your starting point, but the inputs you use are what really matter. For stocks, you have to include dividends. For real estate, you must factor in every cash flow and equity change. For crypto, be obsessive about tracking fees.
By applying the right variables to the right asset, you can accurately compare apples to oranges and make much smarter decisions about where your money should go next.
Beyond the Basics: Advanced ROI Metrics for a Clearer Picture
While Annualized ROI is a fantastic tool for comparing different investments, it does have a blind spot. It works best when you make a single investment and then just let it ride. But let's be realistic—that's not how most of us invest. We add money to our accounts, maybe take some out, and those actions can muddy the waters.
This is where a couple of professional-grade metrics come in, giving you a much more accurate view of what’s really going on with your money.
When your portfolio has cash flowing in and out, you first have to ask yourself: what am I actually trying to measure here? Am I trying to grade the skill of my fund manager? Or am I trying to figure out how my own personal investment journey—deposits, withdrawals, and all—is panning out? The answer to that question points you to the right metric.
Time-Weighted Return (TWR): Measuring Pure Performance
Let's say you want to see how well your mutual fund manager is actually doing their job. Their performance shouldn't get a boost just because you happened to buy more shares right before a market rally, nor should it be penalized if you cashed some out at a bad time. That’s precisely what the Time-Weighted Return (TWR) is designed to measure.
TWR works by breaking up your investment timeline into smaller chunks, with each deposit or withdrawal marking the end of one period and the start of a new one. It calculates the return for each of these mini-periods and then chains them together to get the overall rate of return.
Put simply, TWR strips out the impact of your cash flow decisions. It tells you what the return would have been if you’d invested a single lump sum at the very beginning and never touched it. This is why it’s the gold standard for judging the performance of portfolio managers—it isolates their skill at picking investments from the investor's timing.
The bottom line: Use TWR when you want to evaluate an investment strategy or a manager's performance, separate from your own decisions. It answers the question, "How well did the assets themselves perform?"
Money-Weighted Return (MWR): Gauging Your Personal Results
Now, let's flip the coin. Maybe you want to know how your portfolio has performed, including the impact of your decision to buy more when the market dipped or sell some when things got frothy. Your personal timing is a massive part of your investment story. For that, you need the Money-Weighted Return (MWR).
MWR, which you'll also see called the Internal Rate of Return (IRR), is all about your personal journey. It calculates the specific interest rate that makes the present value of all your cash in (deposits) equal to the present value of all your cash out (withdrawals and the final value of your portfolio).
Unlike TWR, MWR is heavily influenced by the timing and size of your contributions. If you made a huge deposit right before the market soared, your MWR will look great because it reflects your brilliant timing. On the flip side, pulling a lot of money out right before a rally will drag your MWR down. It truly measures your personal investment experience, warts and all.
You can see how these growth rates play out over time by experimenting with a good compound growth calculator for long term investors.
TWR vs. MWR: A Tale of Two Returns
Let’s walk through a quick scenario to see how different these two numbers can be.
You start by investing $1,000. After one month, it grows to $1,200—a solid 20% gain. Feeling good, you deposit another $1,200. But in the second month, the market turns, and your total pot of $2,400 falls to $2,160, a 10% loss.
| Metric | How It Works | The Result | What It Tells You |
|---|---|---|---|
| Time-Weighted Return (TWR) | Looks at each period separately (+20% then -10%) and links them to show how the underlying assets did. | 8% | This shows that the fund's strategy still produced a positive return, regardless of when you added more cash. |
| Money-Weighted Return (MWR) | Accounts for the fact that you had much more money in the game during the losing month. The big second deposit makes that -10% loss hit harder. | -2.2% | This reflects your reality. Your own timing led to a negative return, even though the fund itself was up over the full period. |
Knowing which metric to use is everything. TWR is for judging a strategy in a vacuum. MWR is for judging your personal outcome. Using the wrong one can give you a completely warped view of your investment success.
Common ROI Mistakes and How to Avoid Them
Calculating your ROI seems straightforward on the surface, but a few small oversights can give you a dangerously misleading picture of your performance. Getting this wrong can make a losing investment look like a winner, and it’s a trap many investors fall into.
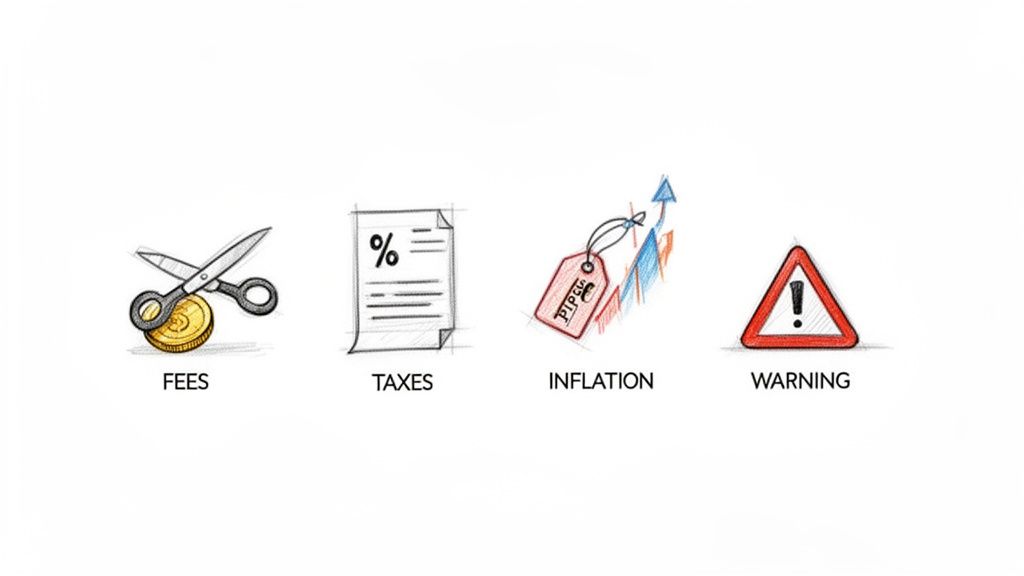
The most common mistake? Ignoring the little costs that bleed your returns dry. Brokerage fees, account maintenance charges, and sales commissions might seem like pocket change, but they directly eat into your net profit.
Think of them as tiny leaks in your financial boat. To get the real story, you have to use a Net ROI calculation that meticulously subtracts every last expense.
Forgetting About Taxes and Inflation
Once you've nailed down the direct fees, the next major blind spot is taxes. Capital gains tax is a real cost tied to your success, and if you don't account for it, you're just fooling yourself about your take-home profit. Your real return is what you have left after the government takes its slice.
Even more sneaky is inflation, the silent killer of your purchasing power. A 7% return feels pretty good, right? But if inflation is chugging along at 3%, your real return is only 4%. Your wealth has grown, but not nearly as much as the headline number suggests.
Key Takeaway: Your "real return" is the only number that truly matters. It tells you whether your money is actually growing faster than the cost of living, which is the whole point of investing in the first place.
History really drives this point home. The S&P 500 has averaged a 9.349% annual return with dividends since 1875. Sounds great. But adjust that for inflation, and it drops to just 6.938%. Factor in another 1-2% for fees and taxes—which is what savvy investors do—and you get a much more sober, realistic picture of long-term market performance.
The Danger of Ignoring Time and Risk
Comparing investments without putting them on the same timeline is a classic rookie mistake. A 20% return over four years is actually a pretty mediocre 4.6% annualized return. That’s far less impressive than a 15% return earned in a single year. Always use the annualized ROI formula to get a true apples-to-apples comparison.
Finally, a huge pitfall is obsessing over ROI without considering the risk you took to get it. A 50% return on a highly speculative crypto asset might look amazing, but it probably came with a very real risk of losing everything. A stable 8% return from a diversified portfolio is often a much smarter move for building long-term wealth.
Always pair your ROI calculation with an honest look at the risk involved. The goal isn't just the highest return; it's the best risk-adjusted return that fits your financial plan and what you can stomach in terms of volatility. Digging into how investment fees are secretly destroying your wealth is another crucial step toward a truly accurate ROI analysis.
Frequently Asked Questions (FAQ)
1. What is considered a good ROI?
A "good" ROI is relative and depends on the investment's risk. A common benchmark is the S&P 500's historical average of 8-10% annually. For higher-risk assets like venture capital or cryptocurrency, investors typically expect a much higher potential return to justify the risk. Ultimately, a good ROI is one that outpaces inflation and helps you meet your personal financial goals.
2. Can ROI be negative?
Yes. A negative ROI means you lost money on the investment; the final value was less than your initial cost. While disappointing, calculating a negative ROI is a valuable learning experience that can help you analyze mistakes and refine your investment strategy.
3. How does ROI differ from profit?
Profit is a simple dollar amount (e.g., "$1,000 profit"). ROI provides context by expressing that profit as a percentage of the initial investment. A $1,000 profit on a $2,000 investment is an excellent 50% ROI, while the same profit on a $20,000 investment is a more modest 5% ROI. ROI measures efficiency, not just raw gain.
4. How do I calculate ROI if I invest more money over time?
When you make multiple contributions to an investment, the basic ROI formula is inaccurate. You should use a more advanced metric like the Money-Weighted Return (MWR) or Internal Rate of Return (IRR). These methods are designed to account for the timing and size of cash flows (deposits and withdrawals) to give a true picture of your personal performance.
5. Why is annualizing my ROI so important?
Annualizing converts returns from different time periods into a standard one-year rate, allowing for fair, apples-to-apples comparisons. A 20% return over six months (44% annualized) is far superior to a 25% return over two years (11.8% annualized). Without annualizing, you can't accurately judge which investment is performing better.
6. Should I include taxes and fees in my ROI calculation?
For the most accurate picture of your actual take-home profit, yes. This is called calculating your Net ROI. Gross returns can be misleading, as transaction fees, management costs, and capital gains taxes can significantly reduce what you actually keep.
7. What is the difference between ROI and ROE?
ROI (Return on Investment) is a personal metric you use to measure the performance of your own invested capital. ROE (Return on Equity) is a corporate finance metric used by analysts to evaluate how effectively a company's management is using shareholders' capital to generate profits. You use ROI for your portfolio; analysts use ROE for companies.
8. How does inflation affect my real ROI?
Inflation erodes the purchasing power of your money. Your real ROI is your nominal (headline) ROI minus the rate of inflation. If your portfolio returns 7% but inflation is 3%, your real return is only 4%. This is the true measure of your wealth's growth.
9. Is a high ROI always a good thing?
Not necessarily. An extremely high ROI is often a sign of extremely high risk. A 100% return on a speculative investment might look great, but it likely came with a significant chance of losing everything. Always evaluate ROI in the context of the risk taken to achieve it. The goal is the best risk-adjusted return, not just the highest number.
10. What other metrics should I use besides ROI?
ROI is a great starting point, but it doesn't measure risk. To get a more complete picture, consider using it alongside other metrics like the Sharpe Ratio (measures risk-adjusted return), Standard Deviation (measures volatility), and Maximum Drawdown (measures the largest peak-to-trough decline).
At Top Wealth Guide, we're committed to giving you the knowledge and tools you need to build and manage your wealth with confidence. Dive into our resources for exclusive insights and proven strategies to strengthen your portfolio and secure your financial future. Learn more by visiting us at https://topwealthguide.com.
This article is for educational purposes only and is not financial or investment advice. Consult a professional before making financial decisions.