
Most investors have no idea how much mutual fund fees are quietly draining their wealth. A 1% annual fee might sound small, but over 30 years it can cost you hundreds of thousands of dollars in lost returns.
At Top Wealth Guide, we’ve seen countless portfolios where hidden charges were the real enemy-not market downturns. This guide shows you exactly what to look for and how to reclaim what’s rightfully yours.
In This Guide
What Exactly Are You Paying For in Your Mutual Fund?
Most mutual fund fees hide in plain sight, buried in prospectuses and annual statements. The Department of Labor estimates that a seemingly small 1% annual fee can shrink your retirement nest egg by nearly 28% over 35 years. That’s not theoretical-that’s real money disappearing from your account every single year.
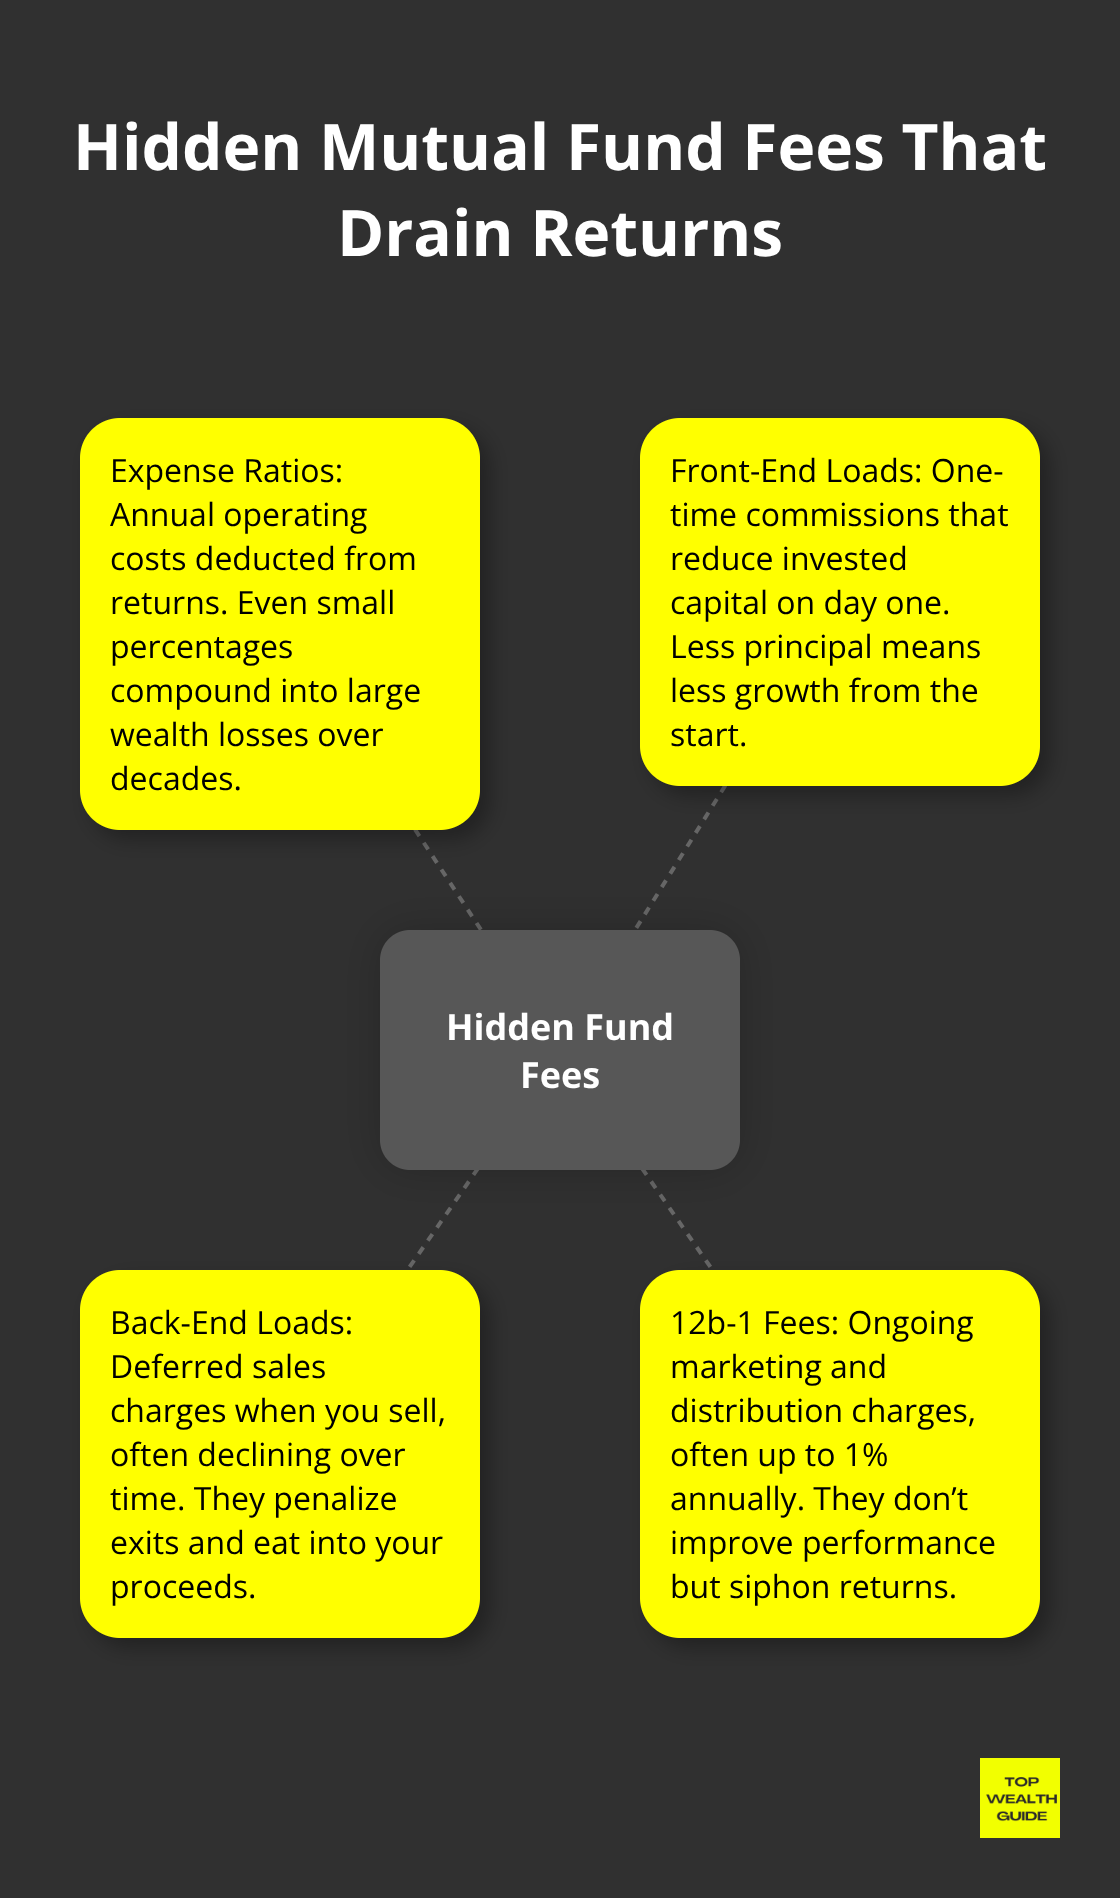
Expense Ratios Form the Foundation of Your Costs
Expense ratios cover management, administration, and operational expenses that get deducted directly from your returns. A typical expense ratio ranges from 0.05% to 2.00% annually, but the damage compounds relentlessly. Consider this concrete example: a $10,000 investment growing at 7% annually over 20 years reaches $38,500 with a 0.10% expense ratio, but only $32,500 with a 1.00% expense ratio-a $6,000 difference driven purely by fees.
That gap widens dramatically with larger portfolios. A $500,000 mutual fund charging 1% costs $5,000 per year regardless of performance, and this expense ratio automatically reduces the amount available for compounding in future years. The SEC reports that a 1% difference in annual operating expenses can reduce 20-year investment returns by about 23% due to compounding alone.
Front-End Sales Loads Strip Money Before It Invests
Front-end sales loads represent another category of hidden fees that immediately reduce your invested capital. These loads typically range from 3% to 6%, meaning if you invest $10,000 in a fund with a 5% front-end load, only $9,500 actually enters the market-$500 vanishes as commission before your money starts working for you.
Back-end loads operate differently, charging you when you sell, often declining over time but still creating a penalty for exiting the fund. The real problem: most investors never calculate what these loads cost in foregone growth. That $500 would have grown substantially over decades, but instead it goes directly to the advisor or distributor. Many investors unknowingly purchase A-shares (front-end load) when C-shares or direct-purchase options offer better economics.
12b-1 Fees: The Marketing Tax You Don’t See
12b-1 fees fund marketing and distribution costs, yet they’re often buried within the fund’s expense ratio at up to 1% annually. Unlike the expense ratio you might notice, these marketing fees don’t improve fund performance-they simply transfer your money to pay for advertising and sales efforts.
A $150,000 portfolio earning 6% annually for 15 years grows to $320,869 with a 0.8% fee but $349,443 with a 0.2% fee, a difference of $28,574 driven partly by these hidden distribution costs. Research shows that over a 10-year period, more than 80% of equity mutual fund schemes leave regular-plan investors at least 25% worse off than direct-plan investors, with the gap driven primarily by embedded distributor commissions in the expense ratio.
The solution exists: switching to direct-plan funds or no-load options eliminates these unnecessary charges while maintaining identical portfolio holdings and management. Your fund prospectus must disclose 12b-1 fees, but they’re rarely highlighted prominently, making them easy to overlook when comparing investment options.
These three fee categories work together to erode your wealth silently. Understanding what you pay matters far less than taking action to reduce those payments-which is exactly what the next section shows you how to do.
What Your Fees Actually Cost Over Time
The Invisible Drain on Your Portfolio
Fees don’t feel painful because they extract themselves invisibly from your returns each year. The real damage emerges only when you calculate what that money could have become.
A $100,000 portfolio earning 6% annually over 20 years grows to $314,716 with a 0.1% expense ratio but only $241,171 with a 1.5% expense ratio-a gap of $73,545 in lost wealth driven purely by fees. This isn’t hypothetical. The SEC confirms that a 1% difference in annual operating expenses reduces 20-year returns by roughly 23% due to compounding.
Scale this to a $500,000 portfolio and a 1% fee costs $5,000 annually. Over decades, that $5,000 compounds into hundreds of thousands in foregone growth. A $200,000 portfolio at 6% annual returns shows the brutal math: 0.75% in fees versus 0.25% in fees creates a meaningful gap that widens every single year.
Why Most Investors Miss the Damage
Most investors focus on fund performance and ignore the fee drag working against them simultaneously. Department of Labor research proves this matters: a 1% difference in fees and expenses reduces your account balance at retirement by 28%. This compounds relentlessly because the fee reduces not just this year’s returns but also next year’s compounding base, creating a cascading effect that destroys wealth silently.
Translate your fund’s expense ratio into actual dollars rather than percentages. Multiply your portfolio value by the expense ratio to see your annual fee in rupee terms-this forces clarity on what fees actually cost you every year.
Regular Plans vs. Direct Plans: The 25% Wealth Gap
The comparison between regular and direct mutual fund plans reveals how destructive these hidden costs become over realistic timeframes. Research analyzing mutual fund data found that over a 10-year holding period, more than 80% of equity mutual fund schemes leave regular-plan investors significantly worse off than direct-plan investors due solely to embedded distributor commissions. In nearly 20% of schemes, the wealth gap exceeds 50% between regular and direct plans-not from different fund management but from cost structure alone.
A concrete example: a $150,000 portfolio earning 6% annually for 15 years grows to $320,869 with a 0.8% fee but reaches $349,443 with a 0.2% fee, creating a $28,574 difference that belongs entirely in your account. Over a 5-year period, 53% of schemes show regular-plan investors losing at least 15% of potential wealth compared with direct plans.
The Compounding Trap That Widens Every Year
The wealth gap widens predictably with time because costs compound while the underlying portfolio management remains identical. Switching from a regular plan charging 1% to a direct plan charging 0.2% doesn’t require picking a different fund-it means keeping more of what you earn. This action step matters more than chasing performance because you control costs completely while market returns remain unpredictable.
The next section shows you exactly how to identify which fees hide in your current investments and what steps to take immediately to reclaim thousands in lost returns.
Stop Paying Hidden Fees Today
Audit Your Current Fees in Three Steps
The path to lower fees starts with three concrete actions: audit what you currently pay, use tools to compare alternatives, and switch to funds that actually serve your wealth. Most investors never take these steps because fee schedules feel technical and time-consuming, but the financial reward for spending two hours on this task can exceed $50,000 over a decade. Your fund prospectus contains everything you need, though fund companies bury fee information deliberately.
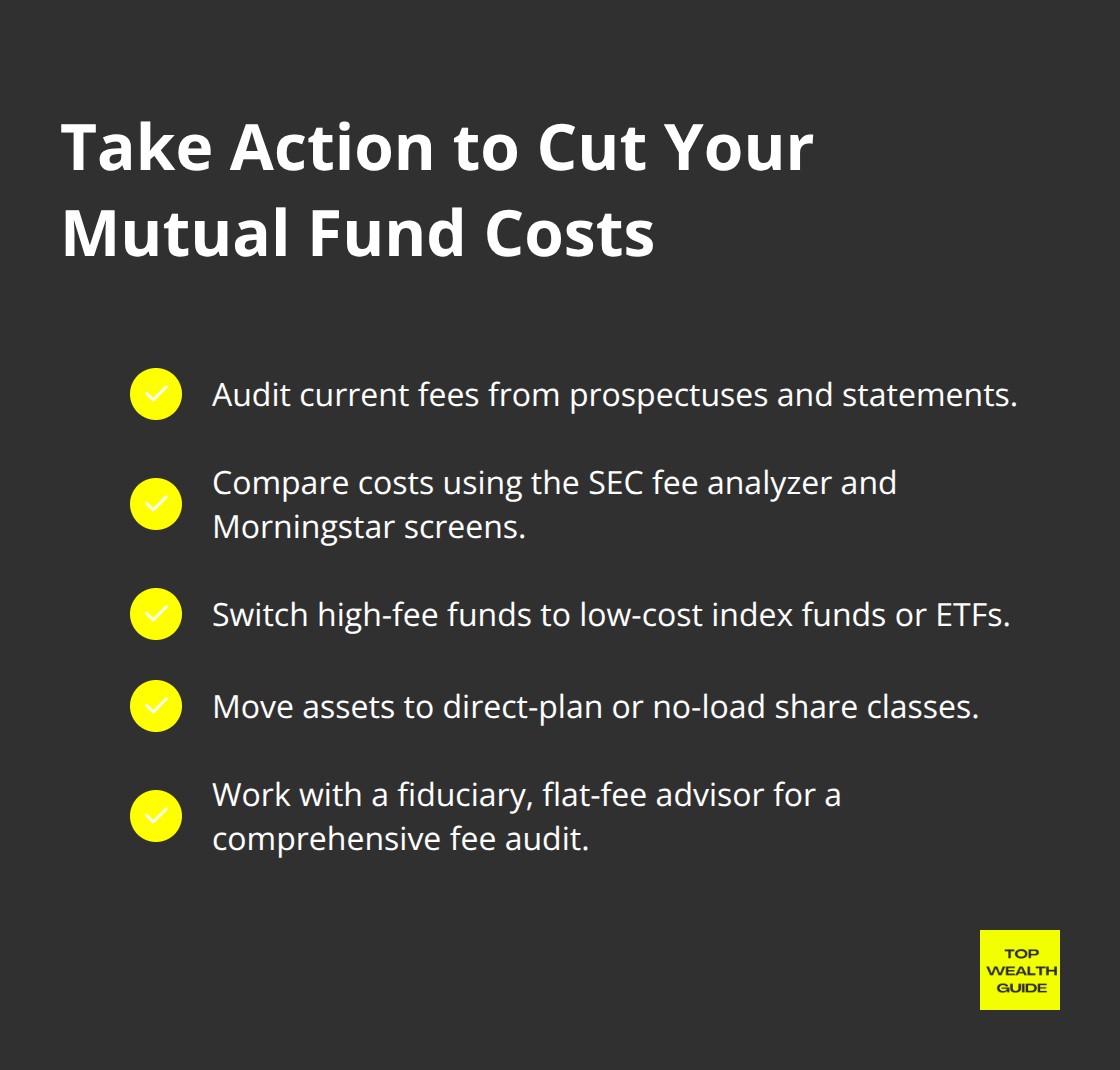
Open your most recent fund statement and locate the prospectus or summary prospectus, then find the fee table near the front. This table lists the expense ratio as a percentage, any front-end or back-end loads, and 12b-1 fees separately. Write down these percentages and multiply each by your portfolio value to see the actual dollars you pay annually. A 0.85% expense ratio on a $300,000 portfolio costs $2,550 per year, money that vanishes before compounding can work in your favor.
Compare Your Funds Against Low-Cost Alternatives
Many investors discover they’re paying 1.2% or higher when index funds charge 0.03% to 0.15% for identical market exposure. The SEC mutual fund fee analyzer tool online lets you input your fund name and see how your costs compare to similar funds, removing guesswork from the comparison process. Morningstar also offers free fund screening where you can filter by expense ratio, fund type, and performance, then compare multiple options side by side with actual fee numbers displayed prominently.
Switch to Index Funds and ETFs
The real decision comes next: switching from active funds to low-cost index funds. Index funds tracking the S&P 500 or total market typically charge 0.03% to 0.10% annually, while actively managed funds charge 0.5% or higher. Research consistently shows that most active managers fail to beat their benchmarks after subtracting fees, meaning you’re paying extra for underperformance.
If your current fund charges 1.2% and underperforms its benchmark, switching to a 0.08% index fund gives you dual benefits: lower fees plus historically comparable or superior returns. A $400,000 portfolio earning 6% annually over 25 years grows to $1,717,673 with a 0.1% expense ratio but only $1,314,529 with a 1.2% expense ratio-a difference of $403,144 that stays in your pocket. Discount brokers now offer commission-free trading on thousands of mutual funds and ETFs, eliminating transaction costs that once made switching expensive. Vanguard, Fidelity, and Charles Schwab all provide low-cost index funds with no minimum investment requirements and no transaction fees when you purchase within their platform.
Start with your largest holdings first, replacing the highest-fee funds with comparable low-cost alternatives. If your fund charges above 1% and hasn’t consistently beaten its benchmark over five years, that fund belongs on your replacement list immediately.
Move to Direct-Plan Funds and Fiduciary Advisors
Direct-plan mutual funds eliminate distributor commissions entirely, reducing your expense ratio by 0.5% to 1% compared to regular plans investing in identical portfolios. Switching from a regular plan to a direct plan requires no market timing or fund selection skill, just administrative action that delivers measurable wealth protection.
Schedule a portfolio fee audit with a fiduciary advisor who charges flat fees rather than commissions, ensuring they have no incentive to recommend high-fee products. This audit typically costs $500 to $2,000 but identifies hidden costs across all your accounts and creates a specific switching strategy tailored to your situation. The advisor should provide written documentation showing your current total fees and projected savings from moving to low-cost alternatives.
Final Thoughts
Hidden mutual fund fees operate through three primary mechanisms: expense ratios that compound silently year after year, sales loads that strip money before it invests, and 12b-1 distribution fees that fund marketing rather than performance. The Department of Labor research proves these costs matter enormously-a 1% annual fee shrinks your retirement nest egg by nearly 28% over 35 years. Most investors never translate percentages into actual dollars, which is why a 0.85% expense ratio on a $300,000 portfolio feels abstract until you realize it costs $2,550 annually.
The wealth destruction accelerates over time because mutual fund fees reduce your compounding base every single year. A $100,000 portfolio earning 6% annually over 20 years reaches $314,716 with a 0.1% expense ratio but only $241,171 with a 1.5% expense ratio-a $73,545 gap driven purely by fees. Regular-plan investors lose at least 25% of potential wealth compared to direct-plan investors over a decade, with some schemes showing gaps exceeding 50%.
Taking action requires three concrete steps: audit your current holdings by locating your fund prospectus and calculating what you actually pay in dollars annually, compare your funds against low-cost alternatives using the SEC fee analyzer or Morningstar’s screening tools, and switch your largest holdings to index funds charging 0.03% to 0.15% annually while moving remaining funds to direct-plan options that eliminate distributor commissions entirely. Switching a $400,000 portfolio from 1.2% fees to 0.1% fees generates over $400,000 in additional wealth over 25 years at 6% annual returns. We at Top Wealth Guide help readers identify these opportunities and build investment strategies that maximize what you keep, since your fees represent the one cost you control completely while market returns remain unpredictable.