
Figuring out what a stock is really worth is the foundation of smart investing. It’s about calculating a company's intrinsic value—its genuine worth based on financial strength and future prospects—and comparing that to its current price tag on the stock market.
This single skill helps you answer the most important question: Is this stock a bargain, fairly priced, or way too expensive? It's the difference between making an educated investment and just gambling.
In This Guide
- 1 Why Stock Valuation Is More Than Just a Number
- 2 Calculating Intrinsic Value with Discounted Cash Flow
- 3 Using Financial Multiples for Relative Valuation
- 4 Expanding Your Toolkit with Other Valuation Methods
- 5 How Market Risk and Volatility Shape Valuations
- 6 Frequently Asked Questions About Valuing Stocks
- 6.1 1. What is the best valuation method for a beginner?
- 6.2 2. How do you value a growth stock that isn't profitable yet?
- 6.3 3. What is the difference between market price and intrinsic value?
- 6.4 4. Can a stock with a high P/E ratio still be a good investment?
- 6.5 5. What is a 'margin of safety' in stock valuation?
- 6.6 6. How does debt affect a company's valuation?
- 6.7 7. How often should I re-evaluate a stock's value?
- 6.8 8. What are some common mistakes to avoid in stock valuation?
- 6.9 9. Why can two analysts have very different valuations for the same stock?
- 6.10 10. Are valuation methods different for international stocks?
Why Stock Valuation Is More Than Just a Number
Before we get into the models and math, let's get one thing straight. The goal here isn't to guess where a stock will be tomorrow or next week. That's a fool's errand. Real valuation is about uncovering the fundamental, long-term worth of the business itself.
A stock's market price is what you pay. It’s a number that bounces around every second, pushed by news headlines, investor emotions, and pure market momentum. But its intrinsic value is what you get—a solid estimate of the company's ability to make money over the long haul.
When you learn how to calculate that value, you gain an incredible advantage. You can spot those rare moments when the market price gets temporarily disconnected from the company's actual worth.
A stock's value is determined by its future cash flows, discounted back to the present. Everything else is just noise. The real skill is separating a company’s temporary market price from its long-term intrinsic value.
Mastering this changes everything. You stop being a speculator chasing hot trends and start acting like a business owner, buying a piece of a company you understand. It’s an approach championed by legendary investors and a cornerstone of building real wealth. For a deeper dive into this philosophy, check out these insights from the master himself: Warren Buffett's value investing secrets revealed on TopWealthGuide.
The Three Lenses of Stock Valuation
To get a full, 360-degree view of a company, it helps to look at it through three different lenses. Each approach tells you something unique, and the most reliable valuations usually pull insights from all three. This table breaks down the main philosophies we'll be exploring.
| Valuation Approach | What It Measures | Best For |
|---|---|---|
| Intrinsic Value | The "true" underlying worth of a business based on its ability to generate future cash flows. | Fundamental, long-term investors looking for undervalued companies with strong financials. |
| Relative Value | How a company's stock is priced compared to its direct competitors or its own historical pricing. | Quickly assessing if a stock is cheap or expensive relative to its peers in a specific industry. |
| Asset-Based Value | The net worth of a company if all its assets were sold and liabilities were paid off. | Analyzing asset-heavy industrial companies, banks, or determining a "floor value" for a business. |
Think of these as different tools in your toolkit. Sometimes you need a microscope (Intrinsic Value), sometimes a yardstick (Relative Value), and sometimes a sledgehammer (Asset-Based Value). Knowing which one to use, and when, is what we'll cover next.
Calculating Intrinsic Value with Discounted Cash Flow
When you want to figure out what a company is really worth, independent of the daily market noise, the Discounted Cash Flow (DCF) model is the undisputed heavyweight champion. At its heart, DCF treats a business like any other asset: its value is the sum of all the cash it can generate for its owners from now until forever.
Of course, a dollar tomorrow isn't worth a dollar today. That's the other crucial piece of the puzzle. DCF systematically "discounts" those future cash flows to tell you what they're worth in today's money. This whole process forces you to put on a business owner's hat, focusing on the long-term, cash-pumping engine of the company rather than short-term sentiment. It's not a crystal ball, but it gives you a solid, logical anchor for your valuation.
Forecasting Future Free Cash Flow
First things first, you need to project the company's Free Cash Flow (FCF) out over the next five to ten years. Think of FCF as the pure cash profit left over after a company pays its bills and reinvests in itself to keep the lights on and grow. It's the cash that could theoretically be handed out to shareholders.
To get these numbers, you'll need to roll up your sleeves and dig into the company's financial statements. You’re essentially making an educated guess about the future based on a few key drivers:
- Revenue Growth Rate: How fast will sales climb? A high-flying tech startup will have a much steeper growth curve than a century-old industrial giant.
- Profit Margins: For every dollar in sales, how much will the company actually keep as profit? Historical margins and industry benchmarks are your best guides here.
- Capital Expenditures (CapEx): How much cash does the business need to pour back into new equipment, factories, or technology just to maintain its edge and fuel its growth?
Getting a handle on cash flow dynamics is non-negotiable for this kind of analysis. If you're new to the concept, our guide on why cash flow management is crucial for wealth building provides some great foundational knowledge.
Determining the Discount Rate and Terminal Value
With your cash flow projections in hand, you need two more critical inputs. The discount rate is the return you’d demand from an investment of similar risk. It's your "what's it worth to me?" number, and it's how you translate future dollars into today's value. Many analysts use the Weighted Average Cost of Capital (WACC), which is a blend of what it costs the company to raise money from both lenders and shareholders. A higher rate implies more risk, which makes those future cash flows less valuable today.
Then there's the terminal value. Since we can't forecast cash flows forever, we estimate the company's value at the end of our initial forecast period (say, in five years) and assume it grows at a slow, steady pace—like inflation—into perpetuity. Be careful here; this single number can often represent over half of the company's total estimated value, so your assumption matters immensely.
DCF boils down to a simple truth: a company's value is a function of how much cash it will generate, for how long, and at what level of risk. Your assumptions about growth, profitability, and the discount rate are the levers that control the entire valuation.
The image below shows how this intrinsic approach fits within the broader landscape of valuation techniques.
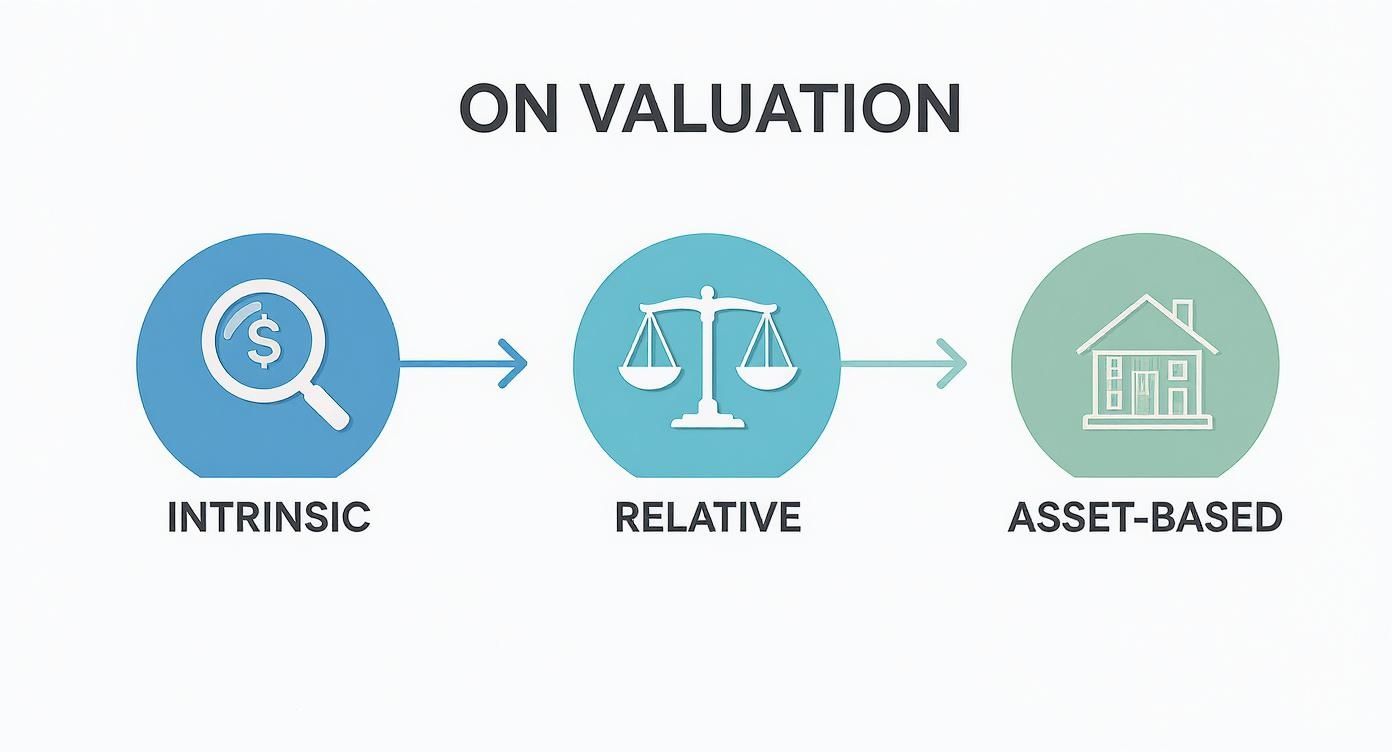
As you can see, DCF is just one perspective. The best analysts often look at a company from multiple angles to get a more complete picture.
Putting It All Together: A SaaS Example
Let's walk through a simplified model for a fictional company, "SaaS Co." We'll project its cash flows for five years, using a 10% discount rate to account for its risk profile and a 2.5% perpetual growth rate to calculate its terminal value.
Here's how we'd discount each year's projected cash flow back to its present value.
| Year | Projected FCF | Present Value (Discounted at 10%) |
|---|---|---|
| 1 | $100 Million | $90.9 Million |
| 2 | $120 Million | $99.2 Million |
| 3 | $140 Million | $105.2 Million |
| 4 | $155 Million | $105.8 Million |
| 5 | $165 Million | $102.4 Million |
| Sum of PV of FCFs | $503.5 Million |
The sum of the present values for the first five years is $503.5 million.
Next, we calculate the terminal value at the end of year five and discount that lump sum back to today. Let's say that works out to $2,340 million in today's dollars.
Adding it all up—the discounted cash flows ($503.5M) plus the discounted terminal value ($2,340M)—gives us an intrinsic value for SaaS Co. of about $2.84 billion.
If SaaS Co. is currently trading on the stock market with a total value (market cap) of $2.2 billion, our DCF model suggests the stock could be a bargain. But this highlights the model's greatest strength and weakness: its sensitivity. If we bumped our discount rate up to 12% to reflect more risk, that final valuation would drop substantially. Your assumptions are everything.
Using Financial Multiples for Relative Valuation
While a deep dive into discounted cash flow can tell you what a stock should be worth in a perfect world, sometimes the best approach is far more practical: just see how it stacks up against its peers. This is called relative valuation, and it’s a lot like shopping for a car. You don’t just evaluate one model in a vacuum; you compare its price, performance, and features against similar vehicles on the lot.
This method uses financial multiples—ratios, essentially—to create a common yardstick. By looking at metrics like the Price-to-Earnings (P/E) ratio, you get a quick, real-time snapshot of market sentiment. You can instantly see if a company is trading at a premium or a discount compared to its direct competitors, the industry as a whole, or even its own past performance.

The Price-to-Earnings Ratio
The Price-to-Earnings (P/E) ratio is easily the most famous multiple out there. It simply compares a company’s stock price to its earnings per share (EPS), telling you how much investors are willing to pay today for every dollar of the company’s profit.
A high P/E can signal that the market has high hopes for future growth. A low P/E might mean the stock is a bargain—or it could be a red flag that the company is struggling. While the historical average P/E for the S&P 500 has floated around 15 to 16, it swings wildly with market sentiment. The legendary investors Benjamin Graham and David Dodd even suggested in their 1934 classic, 'Security Analysis,' that you should average earnings over 5 to 10 years to smooth out the noise.
But context is everything here. Trying to compare a tech startup with a P/E of 40 to a stable utility company with a P/E of 15 is an apples-to-oranges mistake. Their growth outlooks and risk profiles are worlds apart, so a direct comparison is meaningless.
Expanding Beyond Earnings: P/S, P/B, and EV/EBITDA
The truth is, earnings can be volatile. They can even be negative, especially for young companies pouring every dollar back into growth. That's why smart investors never rely on just one multiple. Each one tells a slightly different part of the story.
-
Price-to-Sales (P/S): This ratio is a lifesaver when a company isn't profitable yet. It compares the stock price to revenue, making it perfect for valuing startups or biotech firms. A low P/S might point to an undervalued gem just before it hits profitability.
-
Price-to-Book (P/B): This compares the market price to the company's "book value," which is basically its net assets. It shines when you're looking at asset-heavy businesses like banks, insurers, or industrial manufacturers where tangible assets are the core of the company's value.
-
Enterprise Value to EBITDA (EV/EBITDA): This is a favorite among professional analysts for a reason. It's more of an "apples-to-apples" metric because it accounts for a company's debt and cash levels. By comparing Enterprise Value (EV) to operating profit (EBITDA), you get a much cleaner view, especially when comparing companies with different financing structures or tax situations.
No single multiple is a silver bullet. The real insight comes from using them together to build a complete picture. A stock might look expensive on a P/E basis but cheap based on its EV/EBITDA, which could tell you something crucial about its debt or cash reserves.
Putting Multiples into Practice: A Real-World Comparison
Let's make this tangible. Imagine you’re analyzing two giants in the home improvement space: Home Depot (HD) and Lowe's (LOW). Looking at one company’s numbers in isolation is useless; the magic happens when you compare them side-by-side.
Here’s a quick look at how their valuation multiples might stack up (Note: these are representative figures for illustrative purposes):
| Metric | Home Depot (HD) | Lowe's (LOW) | Industry Average | What It Suggests |
|---|---|---|---|---|
| P/E Ratio | 22x | 18x | 20x | Home Depot trades at a premium, signaling higher growth expectations from the market. |
| P/S Ratio | 2.2x | 1.4x | 1.8x | Lowe's looks much cheaper on a sales basis, trading below both HD and the industry. |
| EV/EBITDA | 15x | 12x | 13x | This confirms the pattern; Lowe's is valued more conservatively based on its operations. |
This simple table immediately tells a story. The market is clearly willing to pay more for Home Depot's earnings and sales, probably because of its stronger brand recognition and historically higher profit margins. Lowe's, on the other hand, looks cheaper across the board.
That doesn't automatically make Lowe's the better buy. Now, your job is to dig in and ask why it's cheaper. Is its growth lagging? Are its operations less efficient? Relative valuation gives you the perfect launchpad for asking these critical questions. It helps you spot the outliers, which is a key skill when you learn how to identify top-performing stocks in the market. From there, you can determine if that valuation gap is a genuine opportunity or a trap.
Expanding Your Toolkit with Other Valuation Methods
While DCF and multiples are the heavy lifters in any investor's toolkit, relying on them alone is like trying to build a house with only a hammer and a saw. Every company is different, and different market conditions demand different tools. To get a truly complete picture of a stock's worth, you need to broaden your approach.
Think of it as building a stronger case for your investment. When a company looks good through a DCF analysis, and its multiples are attractive compared to its peers, and its dividend yield tells a compelling story, your confidence in that investment grows exponentially. This is how you move from just crunching numbers to making genuinely informed decisions.
One of the most classic and direct ways to value a stock is the Dividend Discount Model (DDM). The logic here is beautifully simple: a stock is worth the sum of all its future dividend payments, discounted back to what they're worth today. It directly answers the question every income investor asks: "How much cash is this company actually going to put in my pocket?"
This method is the bread and butter for analyzing mature, stable companies that have a long, reliable history of paying—and growing—their dividends. We're talking about the blue-chip giants, utility companies, and major banks. For businesses like these, a dividend isn't just a distribution of profits; it's a powerful signal of financial strength and management's belief in the future.
To run a DDM, you really only need three key ingredients:
- Current Annual Dividend: How much the company paid out per share over the last year.
- Dividend Growth Rate: Your best estimate of how quickly those dividend payments will increase over time.
- Required Rate of Return: The minimum return you demand for taking on the investment risk, which also acts as your discount rate.
Of course, the DDM has its limits. It’s completely useless for companies that don't pay dividends, which includes most high-growth tech firms and any business that's plowing every penny of profit back into expansion. If you are particularly interested in this style of investing, you can learn more about finding the top dividend stocks for steady income and see which companies are a natural fit for this model.
Finding Value on the Balance Sheet
But what if a company’s future earnings are a total question mark, or it’s stuck in a deeply troubled industry? That’s when you need a safety net, and asset-based valuation is it. Instead of guessing at future profits, this approach focuses on the here and now, valuing a company based on the tangible assets it owns today. It helps you establish a "floor value" for the stock.
The most common metric you'll see is Book Value, which is simply a company's total assets minus its total liabilities. For an even more conservative take, analysts use Liquidation Value—an estimate of the cold, hard cash a company would generate if it had to shut its doors, sell everything, and pay off all its debts.
Asset-based valuation is your reality check. It grounds your analysis in what the company physically owns, giving you a baseline value that isn't dependent on rosy forecasts. This is incredibly useful for industrial firms, real estate holding companies, or when you're sizing up a potential takeover target.
This method really shines when you're looking at capital-intensive businesses or companies navigating financial distress. If you find a stock trading below its liquidation value, it could be a rare opportunity to buy its assets for pennies on the dollar, with any future turnaround potential as pure upside.
Choosing the Right Valuation Method
As you've probably gathered, there's no single "best" method. A fast-growing software company and a century-old railroad simply can't be measured with the same yardstick. Understanding which tool to use, and when, is what separates a novice from an expert.
Here's a quick cheat sheet to help you decide which valuation method makes the most sense for a given situation.
| Method | Primary Use | Pros | Cons |
|---|---|---|---|
| Discounted Cash Flow (DCF) | Calculating the intrinsic value of companies with predictable cash flows. | Provides a fundamental, absolute value based on company performance. | Highly sensitive to assumptions about growth and discount rates. |
| Relative Valuation (Multiples) | Quickly comparing a company to its peers or its own history. | Easy to calculate with readily available data; reflects current market sentiment. | Can lead to misvaluation if the entire industry is over or undervalued. |
| Dividend Discount Model (DDM) | Valuing mature, stable companies that pay regular dividends. | Simple to understand and directly tied to shareholder returns. | Useless for non-dividend-paying stocks; sensitive to growth assumptions. |
| Asset-Based Valuation | Finding a "floor value" for asset-heavy or distressed companies. | Grounded in tangible assets; provides a conservative baseline. | Often undervalues service-based businesses with few physical assets. |
In the end, the most robust analysis comes from using a combination of methods. If a stock looks cheap based on its P/E ratio, and your DCF model also points to significant upside, you can invest with much greater conviction. This triangulation of value is the hallmark of a truly thorough investment process.
How Market Risk and Volatility Shape Valuations
A beautifully constructed spreadsheet can give you a false sense of certainty. But out in the real world, markets are messy, unpredictable, and rarely stick to the script. This is where we need to bridge the gap between valuation theory and market reality by tackling risk head-on.
Every single investment you make carries some level of uncertainty. These aren't just abstract fears; they are real factors like recessions, technological disruption, or a competitor suddenly launching a game-changing product. In a solid valuation, these risks aren't just acknowledged—they're priced directly into the models. It’s how the market answers the fundamental question: How much should I be paid for taking this gamble?
The Role of the Discount Rate and Beta
Remember the Discounted Cash Flow (DCF) model? The discount rate is the single most important lever for quantifying risk. It’s not just some random number you plug in. A higher discount rate means investors demand a higher potential return to compensate them for taking on more risk, which naturally pushes the calculated value of the stock down.
So, how do analysts land on a specific rate? A key ingredient is beta, which measures how sensitive a stock is to the broader market’s ups and downs.
- A stock with a beta of 1.0 tends to move in lockstep with the market.
- If the beta is greater than 1.0, the stock is more volatile than the market.
- A beta less than 1.0 tells you it's less volatile.
It’s just common sense: a high-beta tech stock will demand a much higher discount rate than a sleepy, low-beta utility company. Investors simply won't pay as much for its future earnings because those earnings are far less certain.
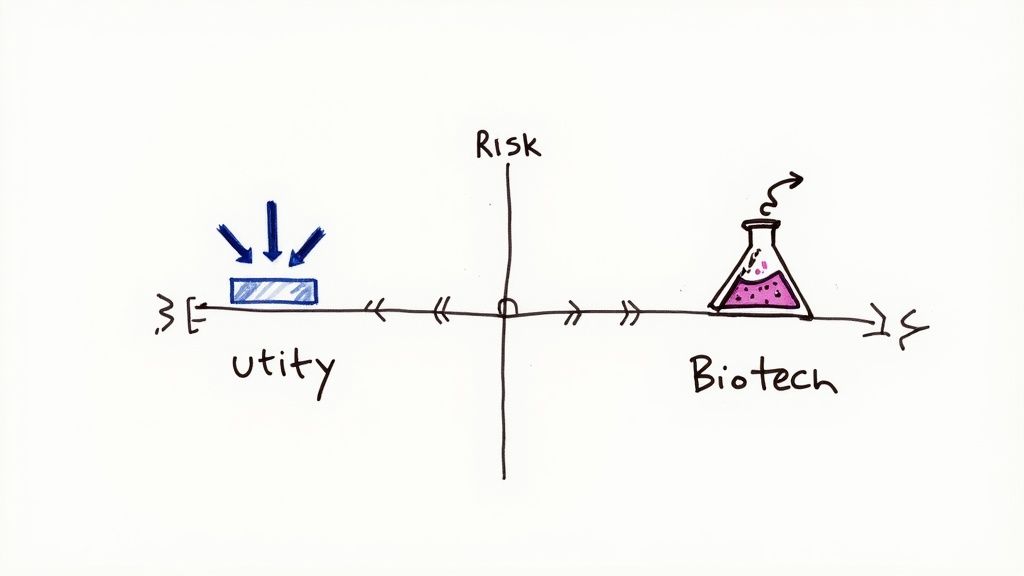
Comparing Risk Profiles: A Biotech vs. A Utility
Let's make this real by comparing two completely different companies: A pre-revenue biotechnology firm and an established utility provider.
| Factor | High-Growth Biotech Firm | Stable Utility Company |
|---|---|---|
| Business Model | Developing new drugs with no guaranteed success. High cash burn. | Provides essential services (electricity, water) with regulated, predictable revenue. |
| Beta (Volatility) | Likely > 1.5. Its success is highly uncertain and tied to market sentiment. | Likely < 0.8. Its demand is stable regardless of the economic cycle. |
| Discount Rate | High (e.g., 12-15%). Investors need a huge potential payoff for the risk. | Low (e.g., 6-8%). The certainty of cash flows requires a lower return. |
| Valuation Logic | Future cash flows are heavily discounted due to extreme uncertainty of drug approval. | Future cash flows are discounted at a low rate due to high predictability. |
The biotech's valuation is essentially a bet on a massive future payoff, but it's discounted heavily to account for the very real chance of failure. The utility's valuation, on the other hand, is built on a steady, reliable stream of cash that gets a much lower discount. The valuation mechanics are the same, but the risk inputs change everything. To get a better handle on these dynamics, you can dive into our guide on what is market volatility.
Stress-Testing Your Assumptions with Sensitivity Analysis
Because your final valuation hinges so heavily on your assumptions, the process isn't over when you get that one "magic number." Smart investors always perform a sensitivity analysis. This simply means building a table to see how your valuation changes as you tweak your key inputs, like the growth rate or the discount rate.
Sensitivity analysis forces you to confront the fragility of your own predictions. It shifts your focus from a single, misleadingly precise number to a more realistic range of potential outcomes, preparing you for multiple future scenarios.
This extra step immediately shows you which assumptions have the biggest impact on your final number. It grounds your analysis in a healthy dose of humility and helps you establish a realistic range of what the stock might actually be worth—an essential habit for navigating the inevitable uncertainties of the market.
Frequently Asked Questions About Valuing Stocks
1. What is the best valuation method for a beginner?
For beginners, Relative Valuation using the Price-to-Earnings (P/E) ratio is the most accessible starting point. The data is widely available, and it provides a quick, understandable snapshot of whether a stock is priced higher or lower than its peers.
2. How do you value a growth stock that isn't profitable yet?
For unprofitable companies, the Price-to-Sales (P/S) ratio is the go-to metric, as it focuses on revenue rather than earnings. For a more in-depth analysis, a Discounted Cash Flow (DCF) model can be adapted by forecasting when the company will reach profitability and what its future margins might look like.
3. What is the difference between market price and intrinsic value?
Market price is the current price at which a stock is trading on an exchange, driven by supply and demand. Intrinsic value is an investor's calculated estimate of a company's true worth based on its financial health and future cash-generating ability. The goal of valuation is to find stocks where the intrinsic value is significantly higher than the market price.
4. Can a stock with a high P/E ratio still be a good investment?
Yes. A high P/E ratio often indicates that the market expects strong future earnings growth. If your analysis confirms that the company can meet or exceed these high growth expectations, the stock could still be an excellent investment despite its premium valuation.
5. What is a 'margin of safety' in stock valuation?
Coined by Benjamin Graham, a margin of safety is the principle of buying a stock at a significant discount to its intrinsic value. For example, if you calculate a stock's intrinsic value to be $100, you might only buy it if the market price drops to $70, creating a 30% margin of safety to protect against errors in judgment or unforeseen problems.
6. How does debt affect a company's valuation?
Debt significantly impacts valuation. In a DCF model, higher debt increases the discount rate (WACC), which lowers the company's calculated intrinsic value. In relative valuation, metrics like EV/EBITDA are superior to P/E because Enterprise Value (EV) includes debt, providing a more holistic view of the company's total worth.
7. How often should I re-evaluate a stock's value?
A good practice is to re-evaluate your holdings at least annually and whenever a major event occurs. This includes quarterly earnings reports (especially with surprises), news of a merger or acquisition, a change in senior management, or a significant shift in the competitive landscape.
8. What are some common mistakes to avoid in stock valuation?
Common pitfalls include using overly optimistic growth assumptions, comparing a company to an inappropriate peer group, ignoring a company's debt load, and becoming emotionally attached to a stock. The biggest mistake is relying on a single valuation method instead of using multiple approaches to confirm your findings.
9. Why can two analysts have very different valuations for the same stock?
Valuation is both an art and a science. Two analysts can arrive at different valuations because they use different assumptions for key inputs like future growth rates, profit margins, and the discount rate. Small changes in these assumptions can lead to large differences in the final value.
10. Are valuation methods different for international stocks?
The core principles remain the same, but you must account for additional risks like currency fluctuations, political instability, and different accounting standards. These risks are typically factored in by using a higher discount rate in a DCF analysis to compensate for the increased uncertainty. For instance, data from sources like PyQuant News can help quantify the historical volatility and risk associated with global markets.
At Top Wealth Guide, our mission is to provide you with the knowledge and tools needed to make smarter financial decisions. To continue your journey toward mastering your investments and building lasting wealth, explore more of our expert guides and resources.
Visit us at: https://topwealthguide.com
This article is for educational purposes only and is not financial or investment advice. Consult a professional before making financial decisions.