
Ever felt like the stock market has a mind of its own? One day it's calm and predictable, the next it’s a chaotic storm. That's market volatility in a nutshell—it's the measure of how quickly and how dramatically prices change. Understanding it is fundamental to smart investing.
In This Guide
- 1 Understanding Market Volatility: Your Investor Compass
- 2 The Real Forces Driving Market Swings
- 3 How Investors Measure Market Volatility
- 4 The Real Impact of Volatility On Your Portfolio
- 5 Proven Strategies for Navigating Volatile Markets
- 6 So, What's the Path Forward?
- 7 Frequently Asked Questions About Market Volatility
- 7.1 1. What is the main difference between volatility and risk?
- 7.2 2. Is high volatility always a bad thing for investors?
- 7.3 3. How can I use the VIX (Fear Index) in my strategy?
- 7.4 4. What are some examples of low-volatility assets?
- 7.5 5. Should I sell my investments when the market becomes volatile?
- 7.6 6. Does diversification still work during a market crash?
- 7.7 7. How long do periods of high volatility typically last?
- 7.8 8. What is the best strategy to use during volatile times?
- 7.9 9. How does inflation affect market volatility?
- 7.10 10. Can I profit directly from volatility?
Understanding Market Volatility: Your Investor Compass

So, what really is market volatility? Think of it as the market's pulse. A stock with low volatility has a steady, slow heartbeat, with its price moving just a few cents here and there. This usually signals stability and a calm consensus among investors.
On the flip side, a highly volatile stock has a racing pulse. Its price can leap or plunge by significant amounts in a short time, reflecting major news, speculation, or a whole lot of investor uncertainty.
Volatility isn't inherently "good" or "bad." It’s a neutral indicator of the market's collective mood—a compass pointing toward confidence or fear.
Getting a feel for this rhythm is the first step toward becoming a smarter investor. It helps you ground your expectations in reality and make decisions based on strategy, not gut-wrenching emotion.
The Two Sides of Volatility: Risk vs. Opportunity
Volatility is a double-edged sword, bringing both risk and reward. Understanding this duality is key to building an investment portfolio that can weather any storm.
| Aspect | The Risk (The Bear Case) | The Opportunity (The Bull Case) |
|---|---|---|
| Psychology | High volatility can be nerve-wracking, tempting investors to panic-sell at the worst possible moment. | Stomach-churning drops can create incredible buying opportunities for those who remain calm and strategic. |
| Financial Impact | Seeing your portfolio's value plummet can turn a temporary "paper loss" into a permanent one if you sell. | When prices tumble, you can acquire high-quality assets at a discount, setting up potentially huge gains on the rebound. |
How well you navigate these swings comes down to your personal comfort level with the market's ups and downs. A great place to start is figuring out your own limits by exploring how to determine your investment risk tolerance in our detailed guide.
History shows us that markets have always moved in cycles of calm and chaos. A deep dive into 90 years of US market data reveals that extreme volatility, while accounting for only about 10% of that time, included massive events like the Great Depression. This tells us that while these dramatic swings are rare, they are a natural and recurring part of the financial landscape. You can find more fascinating insights in this analysis of historical market behavior from the European Central Bank.
The Real Forces Driving Market Swings
Market volatility never just appears out of thin air. It’s what happens when new information hits the street, forcing millions of investors to instantly rethink what an asset is truly worth. These catalysts generally fall into three buckets: economic data, corporate performance, and geopolitical events.
Real-Life Example: Economic Reports
Think of major economic reports as tremors that shake the market. When the government releases fresh numbers on inflation, unemployment, or consumer spending, it's like a real-time health check on the economy. An unexpected jump in inflation, for example, can spark fears of interest rate hikes from the central bank, often triggering broad sell-offs as investors anticipate higher borrowing costs for companies and consumers.
Real-Life Example: Geopolitical Events
Geopolitical events are another massive driver. The outbreak of a war, tense trade negotiations, or political instability in a major economy injects a huge dose of uncertainty. The start of the Russia-Ukraine conflict in 2022 sent shockwaves through energy and grain markets, causing volatility to spike globally as supply chains were disrupted.
Corporate Earnings and Investor Sentiment
Zooming in from the big picture, the performance of individual companies plays an enormous role. When a major company drops its quarterly earnings report, the results can send its stock price—and sometimes its entire industry—on a wild ride.
Real-Life Example: Earnings Surprises
In Q4 2021, Meta (formerly Facebook) reported weaker-than-expected earnings and a decline in daily users for the first time ever. The market's reaction was swift and brutal: the stock plummeted over 26% the next day, wiping out more than $230 billion in market value—the largest one-day loss in U.S. stock market history. This is a prime example of how a corporate bombshell can trigger extreme volatility. For those interested in capitalizing on these dramatic price swings, our guide on the most volatile stocks offers high-risk, high-reward insights.
Key Takeaway: Market volatility is simply the collective reaction to new, often surprising, information. Whether it’s an economic report, a political headline, or a corporate bombshell, these events force a real-time re-evaluation of asset prices.
How Economic Cycles Influence Volatility
There’s a powerful connection between volatility and the broader economic cycle. Periods of economic unease often set the stage for turbulence in the markets. For instance, volatility is known to spike in the months leading up to a recession, reflecting a growing sense of anxiety among investors about what lies ahead.
In fact, studies looking at decades of US market data show that volatility typically starts to climb about three months before a recession officially begins and remains high long after it's underway. This pattern shows how the market tries to "price in" an economic downturn before it’s officially declared, creating the choppy conditions we all know as volatility.
How Investors Measure Market Volatility
Volatility isn't just a vague feeling of anxiety you get watching the news; it's something real that we can actually measure. By putting a number on the market's mood swings, you can stop reacting emotionally and start making decisions based on data. Think of these metrics as a sort of weather forecast for the market, helping you see if there’s a storm brewing.
The most famous of these tools is the CBOE Volatility Index, but you’ll almost always hear it called the VIX. It’s earned the nickname "the fear index" for a good reason. The VIX gives us a real-time look at how much turbulence the market expects for the S&P 500 over the next 30 days.
A high VIX, say anything above 30, means there's a lot of fear and big price swings are likely. A low VIX, especially below 20, points to a calmer, more confident market.
Getting a handle on the VIX is a game-changer. When you see it spiking, you know the market is bracing for a rough patch. For some, that signals risk, but for savvy long-term investors, it can also signal a great time to find some bargains.
Going Deeper With Key Metrics
Beyond the VIX, a couple of other statistical tools give investors a closer look at the volatility of a specific stock or fund: standard deviation and beta. They might sound intimidating, but what they tell us is pretty straightforward.
- Standard Deviation: This one looks back at an asset's history and measures how much its returns have bounced around their average. A high standard deviation means the price has been all over the map—more risk. A low one suggests its performance has been much more stable and predictable.
- Beta: This metric is all about comparison. It measures how a single stock moves in relation to the broader market, which is usually the S&P 500. A stock with a beta of 1 moves right in line with the market. If it's over 1, it's more volatile; if it's under 1, it's less volatile.
Learning to use metrics like these is a huge step in your investing journey. You can take it even further by learning how to read stock charts, which helps you spot these volatility patterns with your own eyes.
To see how this plays out in the real world, just look at the data. In 2021, the stock price volatility index in the United States hit 24.99, a number that screams market uncertainty when compared to calmer years. As a rule of thumb, readings below 15 suggest stability, while anything over 20 points to more erratic behavior. You can dig into these development indicators from the World Bank for more historical context.
Comparing Key Volatility Metrics
To make it easier to see how these tools work, the table below breaks down the most common volatility metrics. Each one offers a different piece of the puzzle, helping you build a complete picture of market risk.
| Metric | What It Measures | Best Use Case | What to Look For |
|---|---|---|---|
| VIX (Fear Index) | Expected 30-day volatility of the S&P 500. | Gauging overall market sentiment and short-term fear. | Readings above 30 suggest high fear; below 20 suggests complacency. |
| Standard Deviation | How much an asset's price has historically strayed from its average. | Assessing the historical price stability of a single stock or fund. | Higher numbers mean more historical price swings and greater volatility. |
| Beta | A stock's volatility in relation to the overall market. | Comparing a stock's risk profile directly against the market benchmark. | A beta > 1 is more volatile than the market; < 1 is less volatile. |
Ultimately, no single metric tells the whole story. By using them together, you can get a much clearer, more nuanced view of what’s really happening in the market and make smarter, more confident decisions.
The Real Impact of Volatility On Your Portfolio
It's one thing to understand the theories behind market volatility, but it's another thing entirely to watch it play out in your own portfolio. When the market starts to swing, theory quickly becomes reality, creating a potent mix of emotional stress and real-world financial opportunity. Learning to navigate both is what separates successful investors from the rest.
The first punch volatility throws is usually a psychological one. When your account value starts to drop during a downturn, it's natural to feel the pressure mount. This fear can easily trigger emotional decisions—like panic selling right at the market bottom. This single move is often what turns a temporary paper loss into a very real, permanent one.
Real-Life Example: The 2020 COVID-19 Crash
In March 2020, global markets crashed as the pandemic took hold. The S&P 500 dropped over 30% in a matter of weeks. Investors who sold in a panic locked in massive losses. In contrast, those who held their nerve—or even continued to invest—witnessed one of the fastest and most powerful market recoveries in modern history. This starkly illustrates the danger of emotional reactions and the benefit of a long-term perspective.
Turning Fear Into Opportunity
Sudden market drops are a gift if you have a long-term mindset. They give you the chance to buy into fantastic companies at a steep discount. Picture it like your favorite high-end store having a massive, unannounced sale—it’s the perfect time to load up on quality assets you believe in for the long haul.
This is where a simple strategy like dollar-cost averaging becomes so powerful. By investing a set amount of money on a regular schedule, you naturally buy more shares when prices are low and fewer when they're high. This simple discipline flips volatility from being your enemy to your greatest ally, systematically lowering your average cost per share over time.
The infographic below highlights some of the key metrics experts use to track these market shifts.
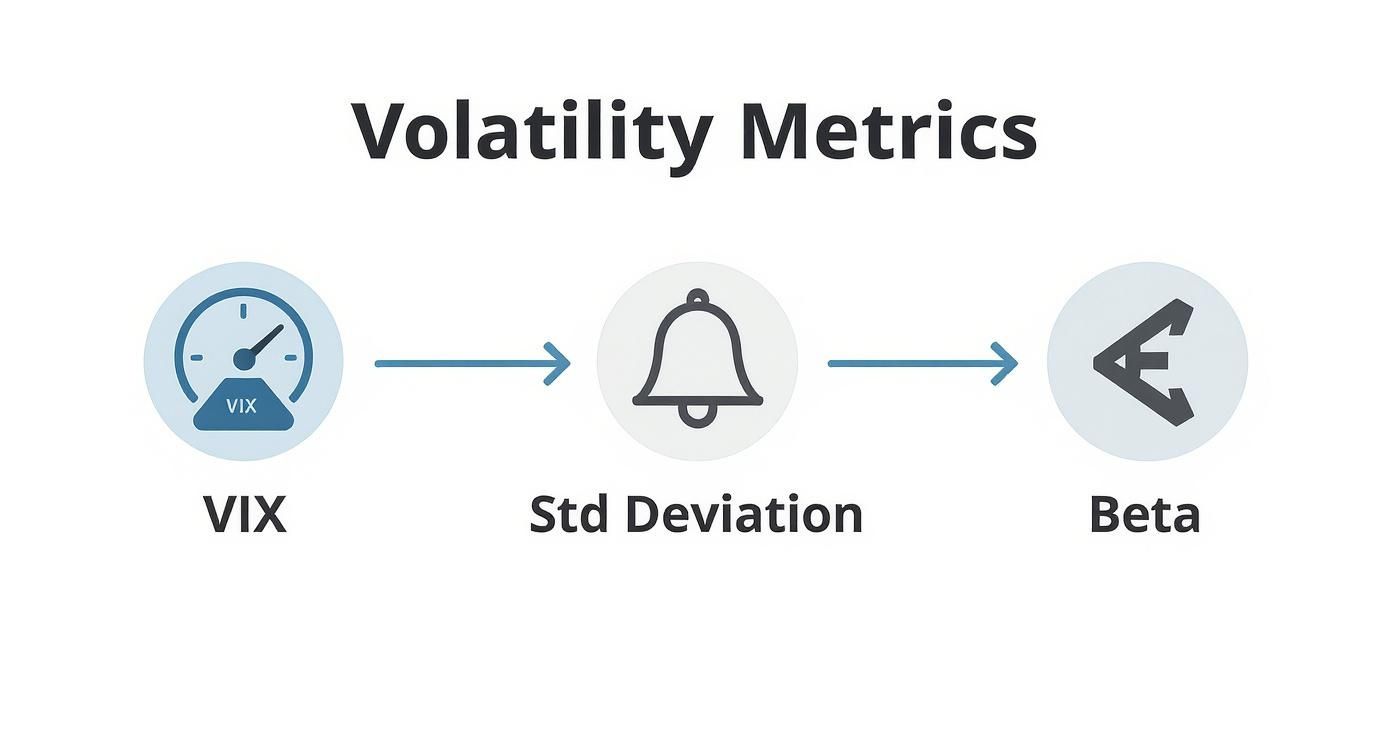
This gives you a glimpse into how tools like the VIX, standard deviation, and beta offer a clear, data-driven picture of market turbulence. Relying on data like this helps you make decisions based on logic, not emotion.
Key Takeaway: The real test isn't about avoiding volatility—that's impossible. It's about having a solid plan to manage it. A well-defined strategy helps you withstand the psychological pressure and capitalize on the buying opportunities that other people's fear creates.
Chaotic markets also provide the perfect excuse to check in on your asset allocation. Disciplined rebalancing keeps your portfolio on track with your long-term goals. Our guide on effective portfolio rebalancing strategies breaks down exactly how to do this. By methodically selling some of your winners and buying more of your underperformers, you can lock in gains and keep your risk level exactly where you want it.
Successfully handling market volatility isn't about perfectly predicting the highs and lows—that's a fool's errand. It’s about sticking to a disciplined game plan. The best strategies are usually the simplest ones, designed to take emotion out of the picture and even turn market swings into opportunities.
The bedrock of any solid investment plan is diversification. And I don't just mean owning a bunch of different stocks. Real diversification means spreading your investments across entirely different asset classes—think stocks, bonds, real estate, and maybe even commodities—and across different countries to protect yourself from a downturn in any single market.
This way, when one part of your portfolio is taking a hit, another part might be holding steady or even thriving, which helps smooth out the overall journey.
Play the Long Game
When the market is tanking, the 24/7 news cycle can feel like a firehose of panic, making you want to sell everything. The single best defense against this impulse is to keep your eyes on the horizon. You have to constantly remind yourself that market drops are a normal part of investing, not some rare catastrophe.
By focusing on your financial goals five, ten, or twenty years from now, the short-term noise of market volatility becomes far less intimidating. This mindset shift is crucial for avoiding reactionary decisions you might later regret.
Put Your Investing on Autopilot
If you really want to beat your emotions, you need to lean on systems, not gut feelings. Two of the most reliable methods for this are portfolio rebalancing and dollar-cost averaging. They give you a clear, logical reason to act, which is exactly what you need when everyone else is panicking.
- Portfolio Rebalancing: This is just a fancy term for periodically resetting your portfolio back to its original target mix. For example, if a great year for stocks means they now make up 70% of your portfolio instead of your target 60%, you’d sell some stocks and use the cash to buy more of an underperforming asset, like bonds. It’s a beautifully simple way to force yourself to sell high and buy low.
- Dollar-Cost Averaging (DCA): With this strategy, you invest a fixed amount of money on a regular schedule—say, $500 on the first of every month—no matter what the market is doing. When prices are low, that $500 buys you more shares. When prices are high, it buys fewer. Over time, this discipline can significantly lower your average cost per share. You can learn how to master dollar-cost averaging for steady wealth growth in our complete guide.
These systems give you a clear path forward, keeping you disciplined when it counts the most.
How to Adapt Your Strategy in Different Markets
Your core strategies remain the same, but how you apply them can shift slightly depending on the market's mood. The table below breaks down what to focus on during high and low volatility periods.
| Strategy | Action in High Volatility | Action in Low Volatility |
|---|---|---|
| Diversification | Provides critical defense as different asset classes react uniquely to downturns. | Continues to manage risk and ensures your portfolio is not overly concentrated in one area. |
| Rebalancing | Presents clear opportunities to sell assets that have held up and buy those that have fallen. | Ensures your portfolio doesn't become too conservative if safer assets have outperformed. |
| DCA | Maximizes your buying power, allowing you to acquire more shares at lower prices. | Continues to build your positions steadily, keeping you invested and disciplined. |
Ultimately, consistency is key. Sticking to these principles will help you not only survive the market's inevitable turbulence but potentially come out stronger on the other side.
So, What's the Path Forward?
In the end, getting a handle on market volatility isn't about having a crystal ball. It’s about being prepared for whatever comes your way. Those wild market swings aren't a sign that your investment plan is broken—they're just a normal, inevitable part of the game. The real trick is to stop seeing the turbulence as a threat and start treating it as a recurring event you can absolutely manage.
The best tools you have aren't some complex newfangled strategy. They're the timeless classics we've talked about: disciplined diversification, a rock-solid long-term mindset, and systematic habits like rebalancing and dollar-cost averaging. Think of these principles as your guardrails, keeping you from making rash decisions based on fear and helping you turn market chaos into a genuine opportunity.
The goal isn't to avoid storms but to build a ship strong enough to sail through them. When you build a plan based on your own goals and how much risk you're comfortable with, you're the one in control.
This kind of preparation is what lets you stay the course with confidence. Instead of getting spooked by the day-to-day noise, you can keep your eyes on the prize—your long-term financial goals—knowing your strategy was built to handle whatever the market throws at it. You’ve got this.
Frequently Asked Questions About Market Volatility
1. What is the main difference between volatility and risk?
Volatility is a statistical measure of how much an asset's price fluctuates over time. Risk is the potential for a permanent loss of capital. While highly volatile assets are often considered riskier, they are not the same thing. A stock can be volatile but still be a sound long-term investment, whereas a seemingly stable company could carry a high risk of going bankrupt.
2. Is high volatility always a bad thing for investors?
Not at all. For long-term investors, high volatility can be an opportunity. It creates periods where quality assets go on sale, allowing investors to buy shares at lower prices. For short-term traders, however, high volatility can lead to significant and rapid losses.
3. How can I use the VIX (Fear Index) in my strategy?
The VIX measures the market's expectation of 30-day volatility for the S&P 500. While you can't invest in it directly, you can use it as a sentiment indicator. A high VIX (above 30) suggests significant fear, which may signal a buying opportunity for contrarian investors. A low VIX (below 20) suggests complacency, which might call for caution.
4. What are some examples of low-volatility assets?
Low-volatility assets typically include government bonds, blue-chip stocks in stable sectors like consumer staples (e.g., Procter & Gamble) and utilities (e.g., NextEra Energy), and precious metals like gold. These tend to have more predictable demand and cash flows.
5. Should I sell my investments when the market becomes volatile?
Panic selling during a downturn is one of the most common mistakes an investor can make. It often locks in temporary losses and causes you to miss the subsequent recovery. A better approach is to stick to your long-term plan, review your diversification, and consider adding to your positions if you have available cash.
6. Does diversification still work during a market crash?
Yes, though it might not feel like it. During a severe crash, correlations between asset classes can increase, meaning everything seems to go down at once. However, a well-diversified portfolio is designed to smooth the ride over the long term. Different assets will recover at different speeds, and diversification protects you from being overly exposed to the worst-hit areas.
7. How long do periods of high volatility typically last?
There is no set schedule. A volatility spike can last a few weeks, as seen during the 2020 COVID-19 crash, or it can persist for over a year, like during the 2008-2009 Global Financial Crisis. The duration is usually tied to the underlying cause of the uncertainty.
8. What is the best strategy to use during volatile times?
The most proven strategy is dollar-cost averaging (DCA). By investing a fixed amount of money at regular intervals, you automatically buy more shares when prices are low and fewer when they are high. This removes emotion from the decision-making process and can lower your average cost per share over time.
9. How does inflation affect market volatility?
High or unpredictable inflation creates significant uncertainty. Investors worry about its impact on corporate profits, consumer spending, and potential interest rate hikes by central banks. This uncertainty leads to more frequent and larger price swings as markets react to new economic data, thus increasing overall volatility.
10. Can I profit directly from volatility?
Yes. Sophisticated traders use financial instruments like options and futures to bet on the direction of volatility itself. For most individual investors, the simpler and more effective way to "profit" from volatility is to use market downturns as opportunities to buy quality long-term investments at discounted prices.
At Top Wealth Guide, our mission is to provide you with the knowledge and tools needed to build and manage your wealth effectively. Explore our resources to deepen your understanding of stocks, real estate, and more. https://topwealthguide.com