
Timing the market… a game of inches that can turn pocket change into a small fortune. Let’s face it, most folks are pulling their hair out trying to figure out when to jump in, get out, or just sit tight.
Here’s the scoop—Top Wealth Guide has crunched the numbers, we’re talking decades of data, to crack the code of savvy investors (the ones who consistently win). This guide lays out the playbook to up your timing game across every major asset class.
In This Guide
Which Market Signals Actually Matter?
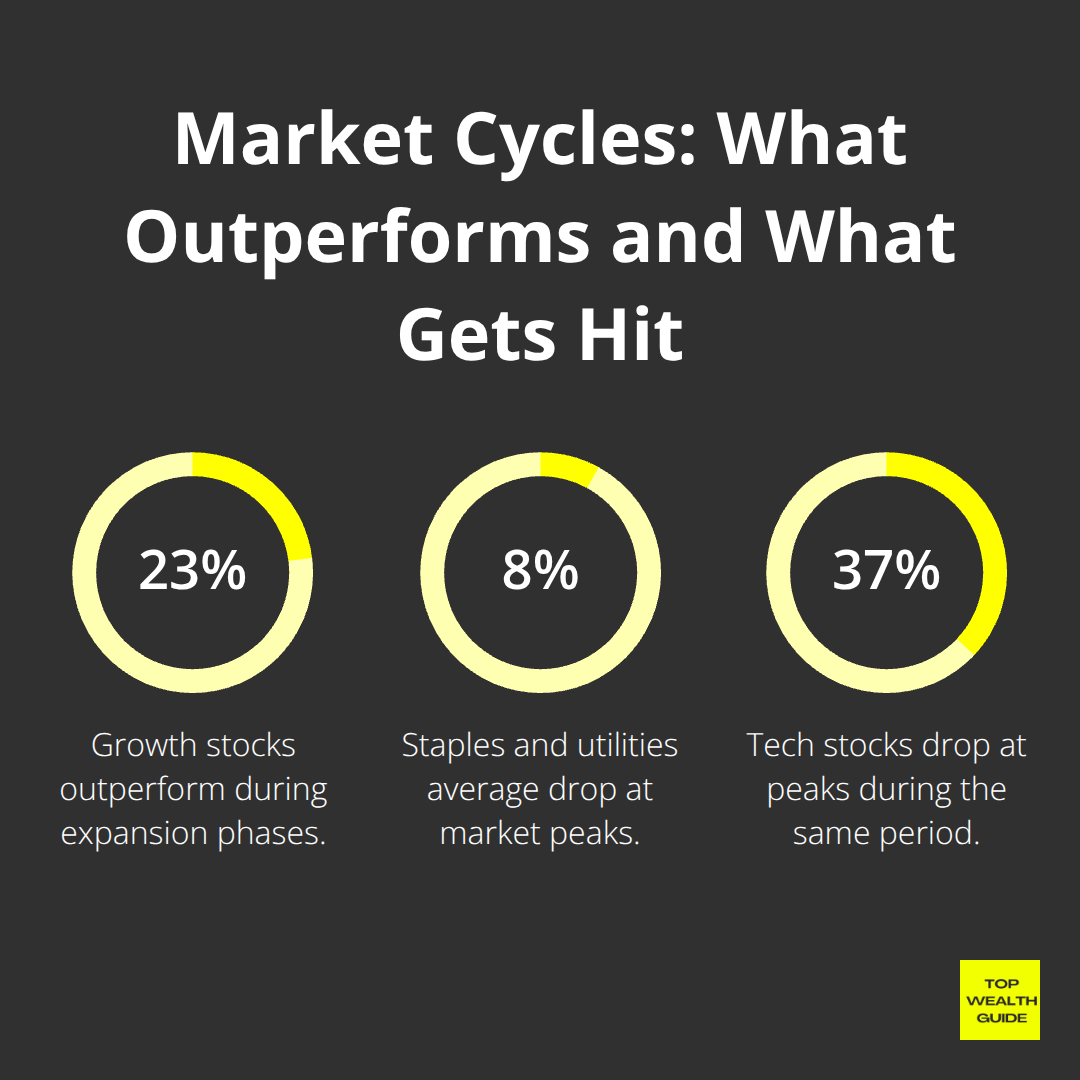
Let’s chat about economic cycles-they’re like clockwork. Investors in the know ride these waves for major returns. The Fed breaks it down: expansion, peak, contraction, and trough. Here’s the hook-growth stocks outperform by 23% during expansion phases. Yep, 58 months is the average run according to the National Bureau of Economic Research. And when we hit the peak? Time to pivot-consumer staples and utilities drop only 8% when tech is taking a 37% nosedive.
The Economic Crystal Ball
Want to predict a recession? It’s all about the yield curve inversion-the gold standard of predictors. You got 7 out of 8 correct calls since 1970. If 10-year Treasurys dip below 2-year yields, guess what? Recession hits in 6 to 22 months. Then there’s the Conference Board’s Leading Economic Index-three-month decline sounds the alarm. Unemployment spikes? A 0.5% rise over a 12-month low means recession is here 100% of the time since 1970.
Technical Indicators That Actually Work
Forget about those complex oscillators-moving averages cut the noise. Take the 50-day moving average, let it cross above the 200-day line, and you’ve got a buy signal. Volume’s your best wingman-breakouts need 50% above average volume to be real. The RSI indicator? Best at the edges-under 30 in uptrends is your green light, over 70 in downtrends? Time to bail.
Price Levels That Matter Most
Support and resistance-the bread and butter of price levels. Round numbers are king. Stocks flip at 00 or 50 way more often, about 40% more than random spots. It’s a psychological game-retail players cluster orders, and the big dogs (market makers) use it to their advantage.
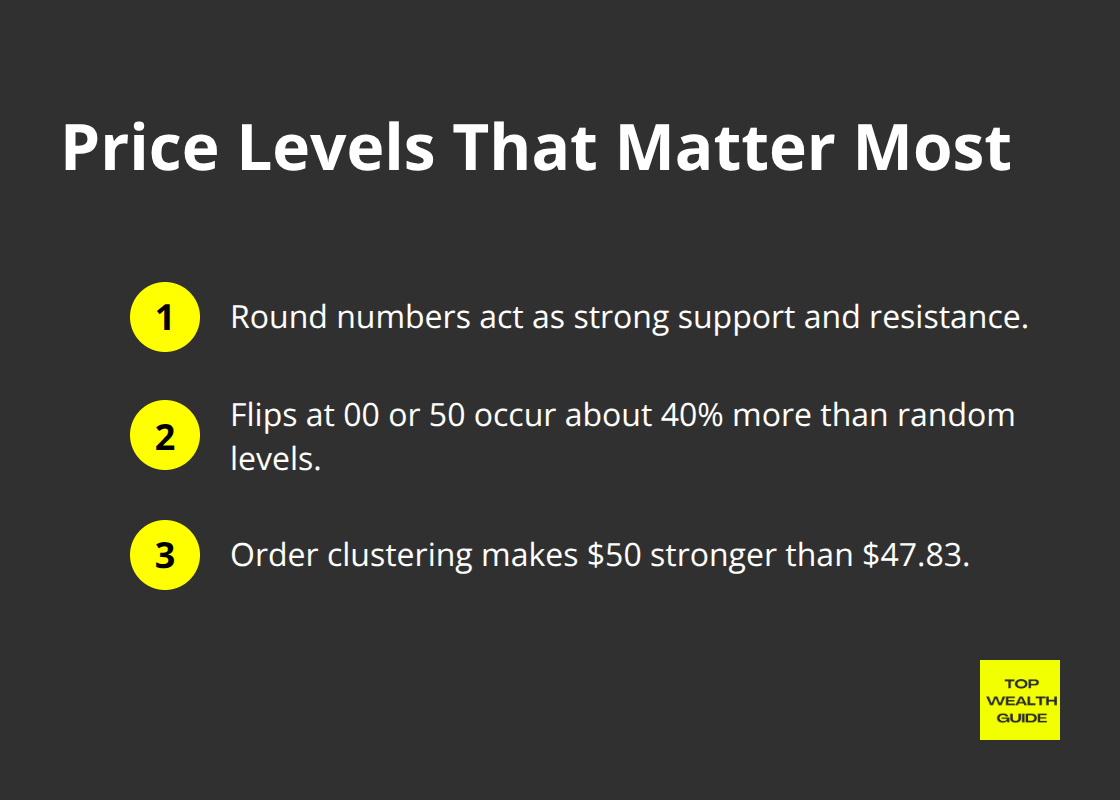
That’s why $50 is a fortress compared to $47.83.
These signals are your playbook for smart asset allocation across investment picks like volatile stocks and dividend stocks.
How Do You Time Different Assets for Maximum Returns?
Stock Market Precision Through Systematic Approaches
Here’s the deal – stock market success isn’t about hitting the bullseye every single time (spoiler: it’s not gonna happen). It’s about showing up, again and again – consistency over perfection. Forget trying to slip in at just the “right” moment. That’s a fantasy. Dollar-cost averaging beats all those wild attempts at timing the market according to some serious number-crunching from 1991-2022. The S&P 500? Well, it hits all-time highs a whopping 16 times a year since 1950. And those sitting around, waiting… and waiting for a dip? Yeah, they’re paying the price – a big one.
Check this out: when the index screams “new high!”, it’s gone up 15.3%, a year later, 12 out of 13 times. Smart money folks? They’ve got a system – they throw in fixed amounts every month, no matter what the market’s doing. When there’s a 10% correction, they amp it up. And when everyone else is freaking out at market peaks? They stay chill. Consistency pays – $166,591 over 20 years compared to $47,105 for the sit-on-the-cash gang. Boom.
Real Estate Cycles and Interest Rate Patterns
Real estate – it’s all about riding the waves of interest rates and local supply. The Fed makes a move, and bam! – there’s an 18-month echo in the housing market. Watch those mortgage trends like a hawk. Rates drop by 1% and, typically, home prices climb 6-8% in two years.
But commercial real estate? That’s a whole other beast. Cap rates shrink when the economy’s booming – perfect time to cash out if you’re a property owner. Nail these cycles and you’re ahead of the game. Building wealth with real estate is all about timing. Got it?
Cryptocurrency and Alternative Asset Strategies
Cryptocurrency – buckle up, folks. This ride demands sharp skills because volatility is its middle name. Bitcoin? It hugs tech stocks with an 80% correlation during market craziness but then does its own thing with crypto-specific shocks. That 200-week moving average? Holy grail alert – it’s Bitcoin’s ultimate buy signal, a prime macro indicator you don’t wanna ignore.
And then, there are the alternative investments… enter commodities. During inflation spikes, they shine – Gold gains like crazy, and energy stocks leave the rest in the dust, outperforming by 15% during supply shocks. Different beasts require different strategies. So, investment diversification isn’t just a tip – it’s survival in the risk management world.
The big boo-boo? Investors letting emotions steer the ship instead of data. The next section? It’s gonna spill the beans on wealth-wrecking mistakes and strategies to steer clear. Stay tuned.
Why Smart Investors Fail at Timing
The biggest wealth assassin? Not market crashes, folks. Not even economic downturns. It’s your own brain-your grey matter working against you. Behavioral finance research from Dalbar? Yeah, it reveals the average investor made a measly 3.6% annually over two decades while the S&P 500 was chilling with a cool 10.5%. That chasm? It ain’t nothing but pure emotional carnage.
FOMO Destroys Portfolios at Market Peaks
FOMO-fear of missing out-it’s a portfolio’s worst enemy when bull runs get hotter than a summer sidewalk in Phoenix. Retail investors, they dive in at the zenith, just when GameStop taught us its painful lesson. January 2021-retail participation skyrocketed 600%… right before it all went splat. Abandoning strategy and chasing performance? It turns potential winners into surefire losers. We’ve been here before-dot-com, housing, crypto… the spiel doesn’t change. Smart money exits while retail money? It comes pouring in like a tsunami.
The Over-Trading Death Spiral
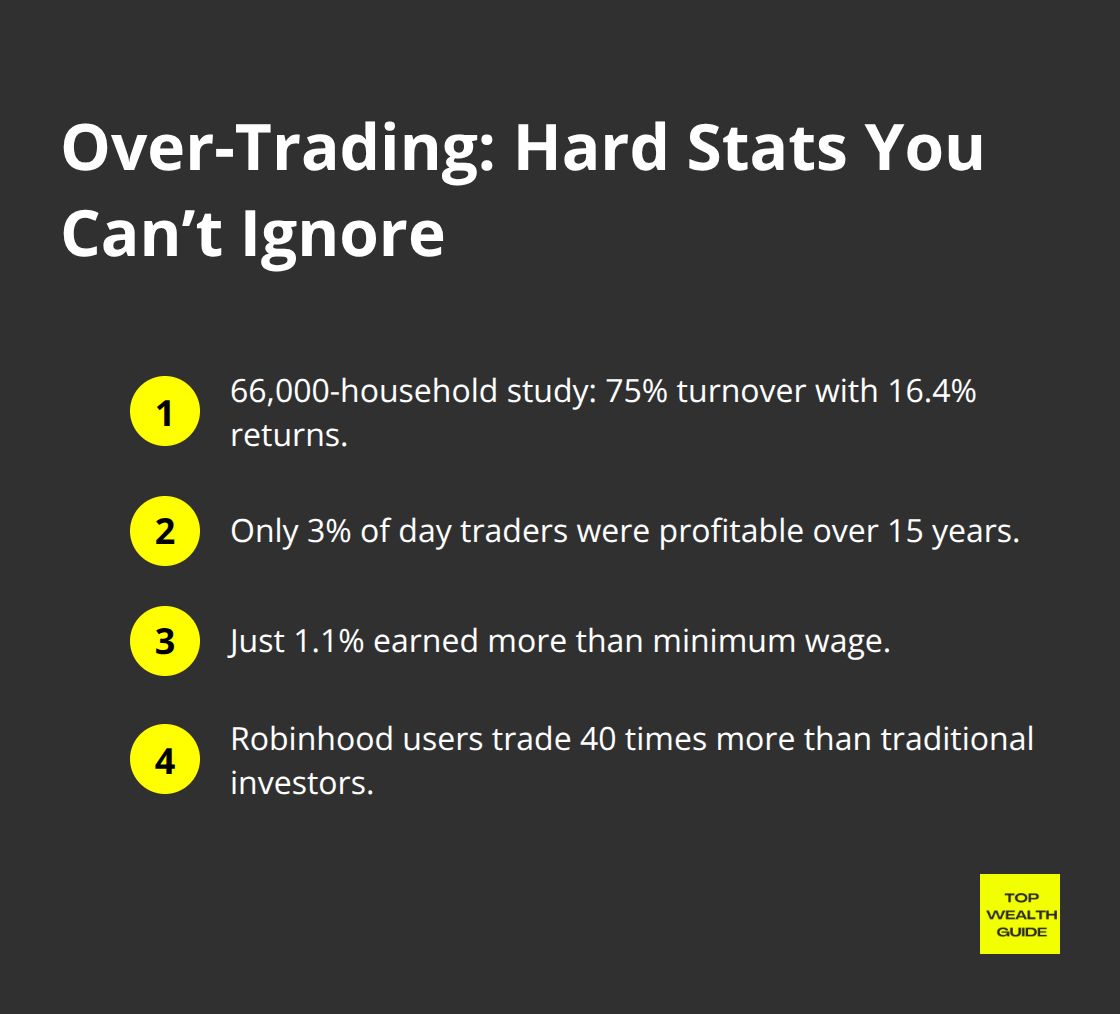
Active traders? They’re like moths to a flame. Barber and Odean clocked this with 66,000 households-average returns of 16.4% with 75% portfolio turnover. Day traders? Oh boy-only 3% emerged in the black in Brazilian market data spanning 15 years. Only 1.1% made more than minimum wage.
Commission-free apps? They threw gasoline on the fire. Robinhood users trade 40 times more than the old-school brokerage crowd.
But each trade? It nibbles at returns through spreads, slippage, and all-around poor execution. The math is the soul-crusher here-transaction costs and taxes just carve away gains faster than most can even spell ‘alpha.’
Short-Term Focus Kills Long-Term Wealth
Market timing-it sounds genius, but numbers? They don’t fudge. Miss just the 10 best days over two decades-investment returns nosedive, says J.P. Morgan Asset Management. That’s the tightrope between stacking serious wealth and pedestrian results.
Perfect market timing-over 20 years-barely edges past consistent investment. And those cash sitters waiting for the moment? They lose big-time over poor timing. Opportunity cost of the impeccable approach? It crushes any bonus from precision.
Emotional Reactions Override Logic
Here’s a riddle-what crashes harder than any market? Emotional investing. Panic-peddlers sell at bottoms, greed-mongers buy at tops. They slash more wealth than any crash. Investors yanked $326 billion from equity funds during March 2020’s plunge-missed the 70% bounce-back. The same folks bailed at S&P 500’s 2,200 then chased it at 3,500.
Automatic investment plans-they’re like emotional defense mechanisms. They yank emotion out of investing entirely. 401k buffs using auto-escalation amass 16% more wealth than manual contributors driven by financial faux pas.
Final Thoughts
Forget about nailing the perfect buy-in… investing is about having a game plan that rides the market rollercoaster. Consistency over chaos-that’s where the money is. Case in point: dollar-cost averaging turns into $166,591 over two decades, while those trying to time the market end up in a melodrama of bad choices that shred wealth.
Here’s your trifecta: automate those monthly investments like clockwork (no matter what CNN says about the market), spread your chips across various asset classes, and, oh yeah, chill out when things get bumpy. Markets hit new peaks 16 times a year, and chasing those peaks costs you big time compared to just doing something-anything. The S&P 500? It’s like clockwork: positive returns 92% of the time one year after new highs.
Start with whatever you’ve got right now and set up those no-brainer transfers to your investment accounts. It’s about being in the game, not always swinging for the fences. The crew at Top Wealth Guide knows a thing or two: that smart money piles up through discipline, not wild guesses. Our data backs it up-you build lasting wealth (check it out) by staying the course, not chasing unicorns.