
Stock market cycles — they rinse and repeat throughout history, like a predictable rollercoaster — serving up chances for investors who’ve got the pattern down. The S&P 500? It’s danced through 12 full cycles since 1957, each hanging around for, oh, an average of 5.1 years.
Our squad over at Top Wealth Guide thinks — strike that — knows timing your investments with these cycles can seriously amp up your returns. The problem for most folks? They’re like lemmings — buying high on euphoria, then dumping low in a panic.
In This Guide
How Do Market Cycles Actually Work?
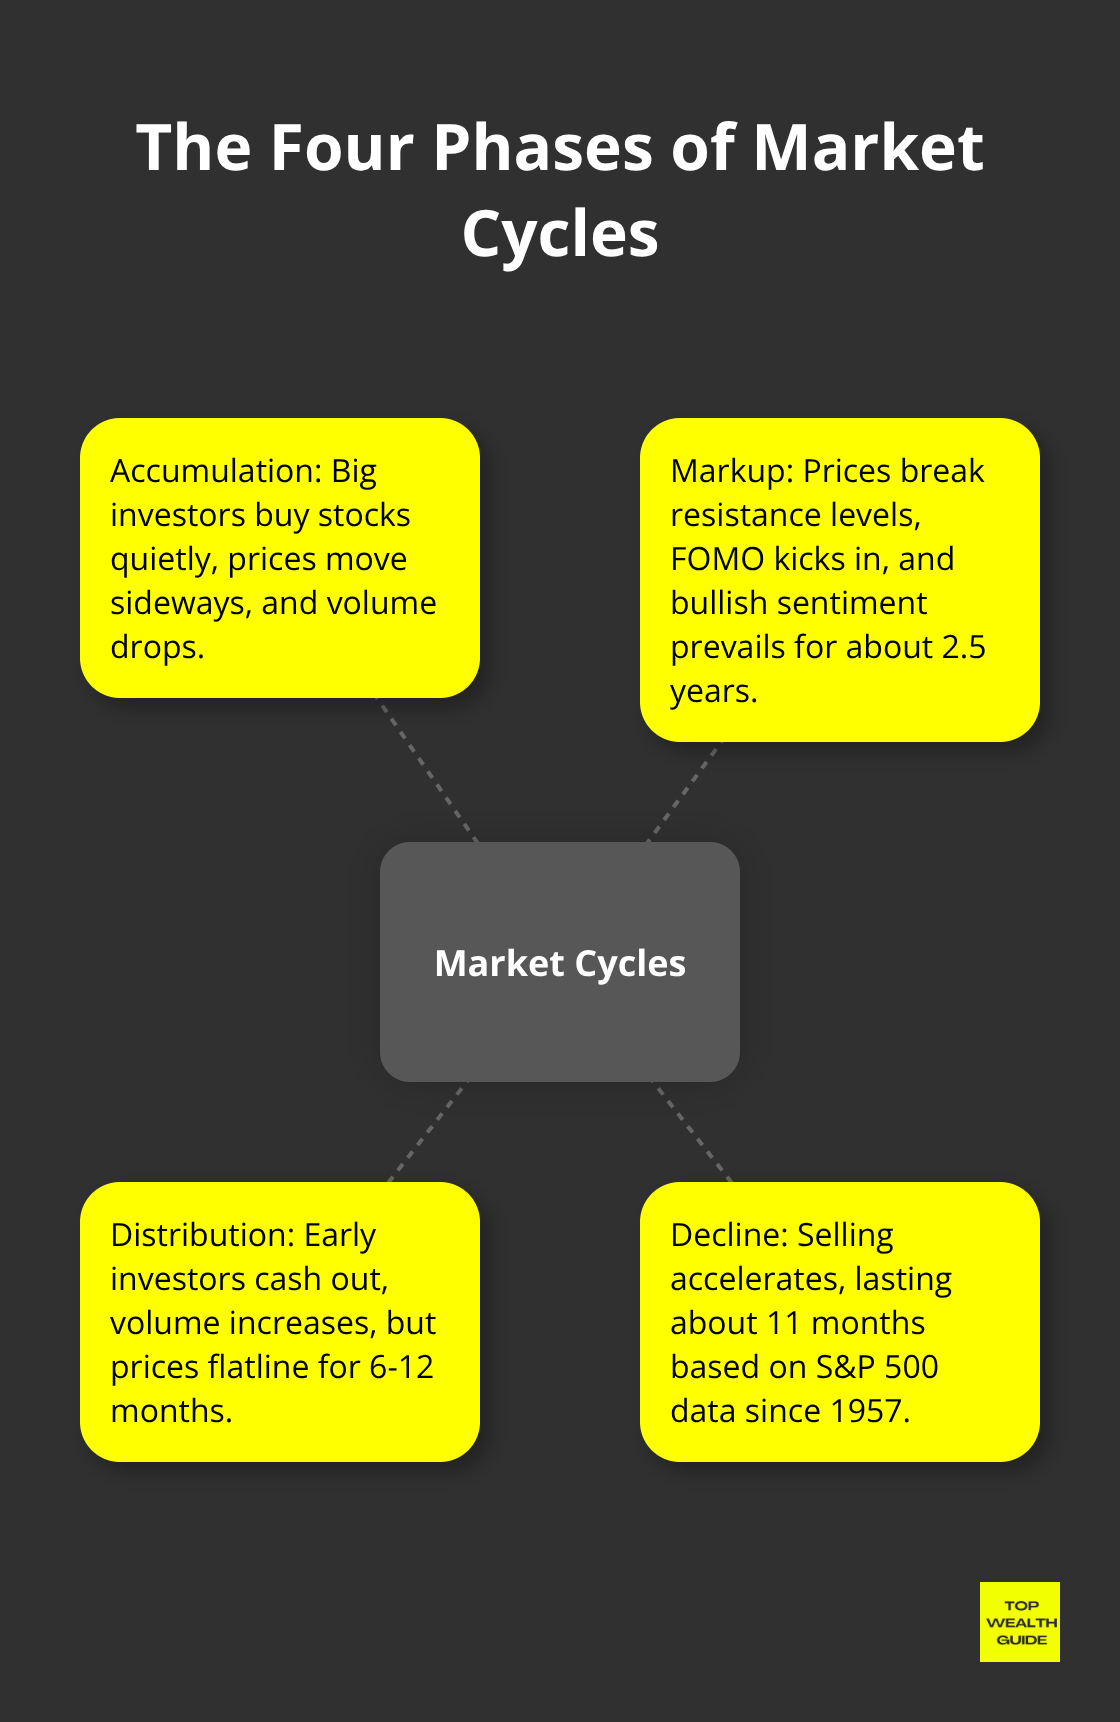
Alright folks, let’s talk about stock market cycles – they’re like your mom’s favorite soap opera, looping back with the same drama yet somehow still grabbing our attention. There are four phases, each with its own vibe. First up, the accumulation phase – picture this. Big-time investors are sneaking around like ninjas, buying stocks on the down-low while everyday folks are still licking their wounds from past losses. You’ve got sideways price movement and volume dropping like a stone. Smart money is in stealth mode here, picking up bargains.
The Four Phases Break Down Simply
Next is the markup phase – we’ve hit paydirt, baby. Prices bust through resistance levels, and suddenly, everyone’s in FOMO mode. Ned Davis Research says this bullish party runs about 2.5 years, and it’s the sweet spot for returns because companies are shouting about their growth and economic data is all sunshine and rainbows. Then, in waltzes the distribution phase – early birds are cashing out, volume’s through the roof, yet prices are flatlining for 6-12 months. Finally, we crash into the decline phase with the selling speeding up. It lasts about 11 months if you look at S&P 500 data since 1957. Ouch.
Economic Indicators Signal Phase Transitions
The puppet master here? The Federal Reserve, of course. They shuffle the deck with interest rate tweaks – cuts often signal accumulation phases, while hikes scream “distribution starts now!” Corporate earnings climbing above 15% mean we’re probably in late markup territory, but when those numbers dip below -10%, you bet the decline phase is warming up. Speaking of signals, the yield curve is like your market psychic predicting recessions. Unemployment? Below 4% signals distribution; above 7%, and it’s accumulation season.
Volume Patterns Reveal Phase Strength
Want to peek behind the curtain? Look at volume spikes. They’re the market’s way of flashing an “open for business” sign, showing us psychological shifts and price action on the horizon. During accumulation, high volume yet sideways prices mean big players are stockpiling without moving prices. In the markup phase, low volume rallies might say “buyer’s beware” – participation’s weak, and reversals could be around the corner. Meanwhile, in distribution, heavy volume at resistance creates those topping patterns technical analysts drool over (head and shoulders, anyone?).
These volume cues lay the groundwork for which investment strategies are in vogue for each phase.
How Do You Spot Each Market Phase
So, the 50-day moving average plays leapfrog with the 200-day average – and bam, that signals the start of an accumulation phase 78% of the time, per StockCharts. And don’t sleep on the Relative Strength Index. Below 30? You’re in prime entry territory. Above 70? Whoa, pump those brakes. Now, the VIX, our old fear gauge friend, spills all the tea. Above 30? It’s an accumulation fest. Below 15? Distribution alarms blaring.
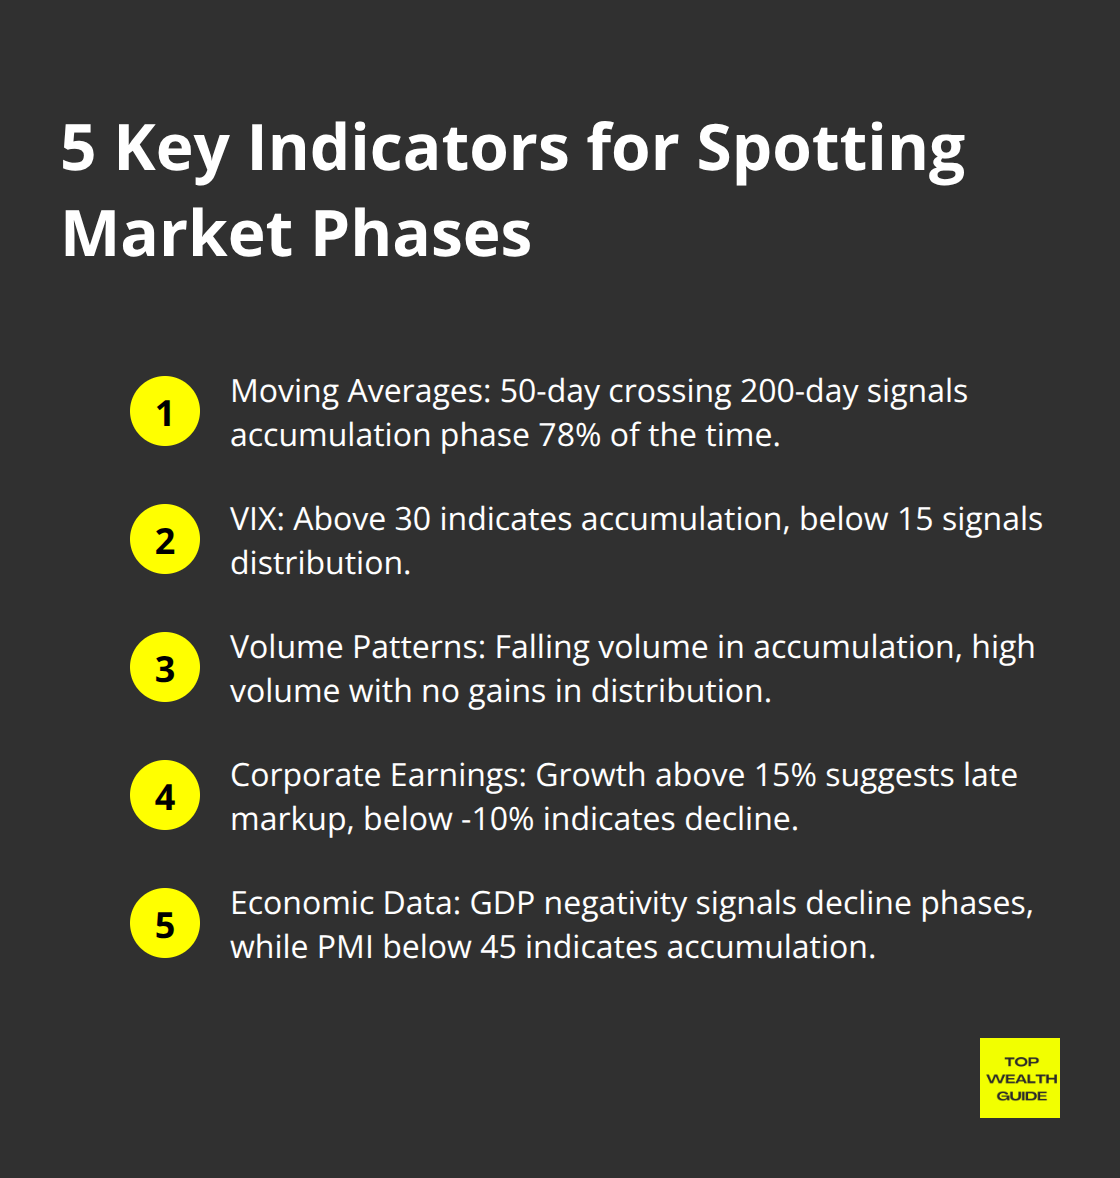
Here’s a nugget: volume is the unsung hero. Accumulation equals falling volume with prices playing it cool; markup is jazzed-up volume and prices rocketing; distribution means lots of noise and no gains, and declines are your frantic sale-a-palooza with volume through the roof.
Corporate Earnings Drive Phase Recognition
Earnings growth above 15%? That’s your late markup phase invite, whereas a nosedive over -10% screams decline territory. P/E ratios for the S&P 500 – during accumulation phases – are like your solid friend, showing stability while the economy gets its act together. Don’t forget interest rates: Fed cuts below 2% usually mean accumulation time, but rates above 5%? Distribution phase on the move, my friend. Unemployment below 4% means you’re late in the distribution dance, above 7%? Knock, knock, it’s accumulation season.
Investor Psychology Patterns Reveal Phase Timing
Retail investors-they’re such creatures of habit. When 60% howl “bearish,” it’s an accumulation bottom party. But flip the sentiment to bullish over 60% and… you guessed it, distribution tops. FINRA’s margin debt laughter peaks during late markup and hits 2.8% of market cap before the crash party. Corporate insiders? They’re racing to sell during the distribution shindig with crazy 8:1 sell-to-buy skew, but during accumulation, they’re on a shopping spree. Options put-call ratios blowing past 1.2 shout fear (hello, accumulation), while sliding below 0.7? Yeah, that’s markup’s greedy fingers.
Economic Data Confirms Phase Transitions
Despite the sticker shock of high valuations and inflation rumbles, economic growth is like the Energizer Bunny – just keeps going, backing bull markets. But GDP negativity? Curtain call – decline phases. Consumer confidence under 80? Time to accumulate. Above 120 is your distribution phase flare. Watch those credit spreads; 200 basis points and up equal pressure cooker declines, under 100 suggest late markup jazzy sessions. And Manufacturing PMI below 45? Welcome to recessionville and your accumulation entry ticket.
All these signals are your market map, painting a can’t-miss picture of phase transitions, but nailing it? That’s in the strategy specifics.
What Investment Strategy Works Best for Each Cycle Phase
Accumulation phases-where the braver folks, aggressive value hunters, swoop in while the crowd runs for the hills. Remember when Warren Buffett ponied up $5 billion in Bank of America during the 2011 financial smackdown via preferred shares at a sweet 10% dividend? Dollar-cost averaging does its magic here. Vanguard research? Yep, it shows this approach lowers portfolio jitters, way better than clinging to cash like a life raft. It’s all about methodical exposure during those market nose-dives.
Accumulation Phase Value Opportunities
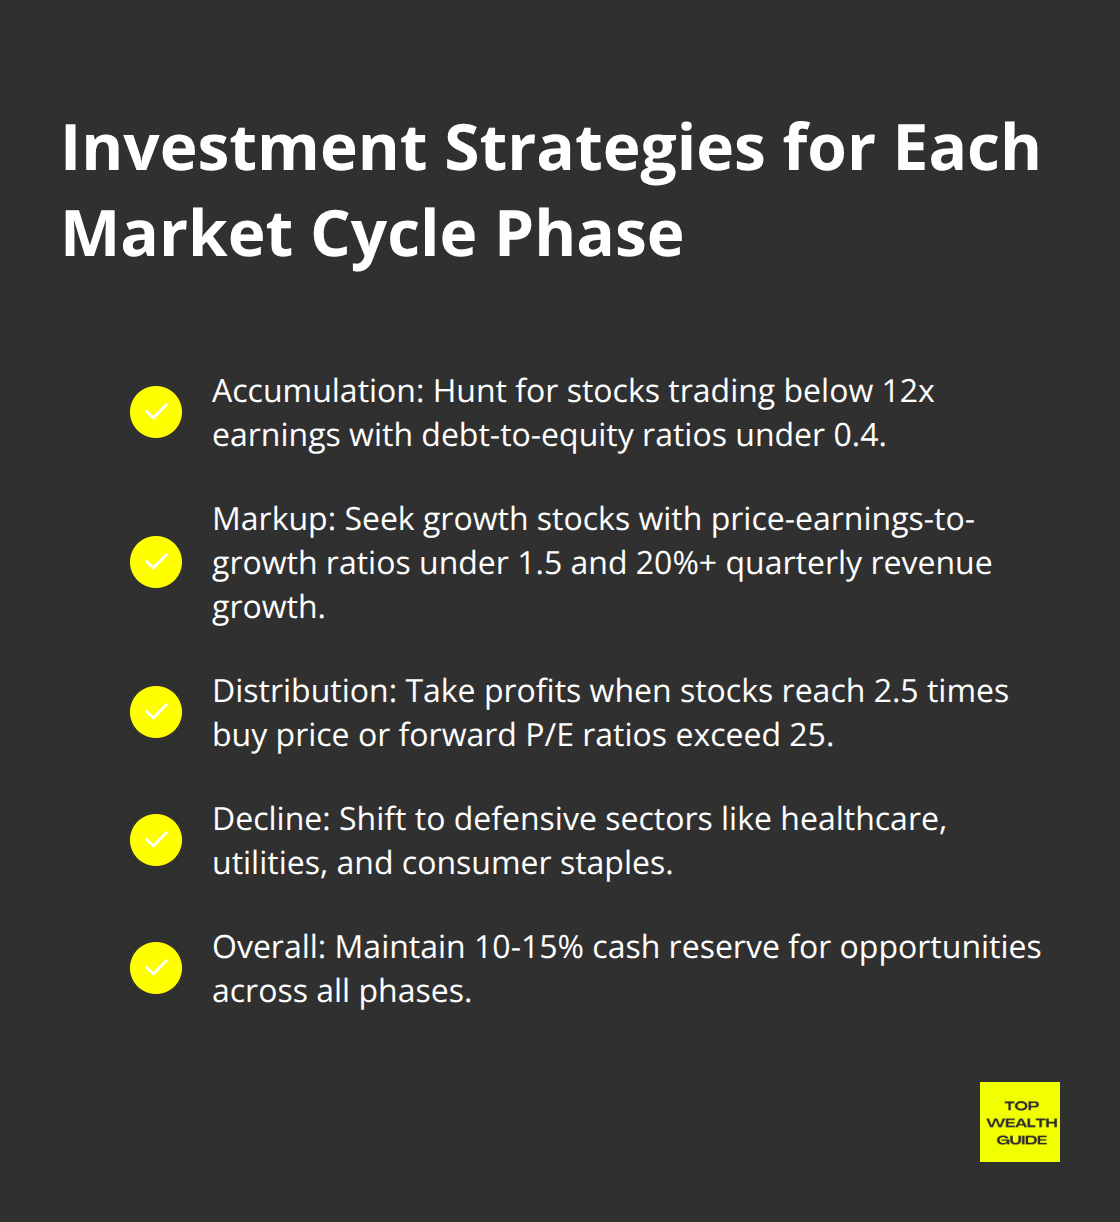
Here’s the play-hunt for stocks trading below 12x earnings, debt-to-equity ratios under 0.4. Zero in on consumer staples, utilities, dividend aristocrats; you know-the tried-and-true that keep those dividends flowing when the world seems upside down. These spaces? They’re rock-solid when everybody else has lost their marbles. Companies with solid balance sheets, keeping the cash coming (they’ll waltz through economic hurricanes).
Markup Phase Growth Stock Selection
Markup phases-where the bold momentum pursuers catch a ride on earnings rockets. Take Apple’s wild ride from 2016 to 2021-racking up an eye-popping 400% for growth stock believers spotting earnings jumps over 25%. Seek out those gems with price-earnings-to-growth ratios under 1.5, and revenues-yeah, 20%+ growth quarterly. Technology? Healthcare innovation? Consumer discretionary? This is their stage in markup phases.
Distribution Phase Profit-Taking Strategies
Distribution phases-sorts the sharp cookies from the rest, thanks to profit-taking smarts. Snip positions when stocks climb to 2.5 times your buy price or forward P/E ratios jump past 25. Goldman Sachs throws down stats: cutting equity from 80% to 60% in these phases safeguarded 23% more green during following slumps. Set stop-losses 15% below what you paid, and then-nail down those wins until technical signals give the red alert.
Decline Phase Defensive Positioning
Decline phases-shift gears into safety zones like healthcare, utilities, and consumer staples. Stack up cash to 20-30% of your investment fort while holding those core dividend stocks tight. Keep your eyes peeled for insider dump ratios over 8:1, they’re like neon exit signs (often right before big market tumbles). Company insiders-they’ve got the inside track, and their actions, louder than any quarterly chat.
Final Thoughts
Stock market cycles-like clockwork, folks. They roll around with such precision it’s almost scary. Understanding these cycles? That’s your ticket to outperforming the knee-jerk crowd. Numbers don’t lie: cranking your strategy to match these cycles can see you beating the buy-and-hold gang by 3-4% annual returns. Yep, these cycles-they’re the backbone of sharp investment decisions, rain or shine.
Keep your eyes glued to those key indicators-50-day and 200-day moving averages, the VIX, and corporate insider moves. They’re your compass through the four twists and turns of market cycles. And yeah, these signals? They shout out when to jump in and when to gracefully exit.
Start today-like, right now-with moves that will set you up. Stash 10-15% of your portfolio in cash for when you strike gold, and start those systematic investments during markup times. Nail down your profit-taking rules before those distribution peaks sneak up (and, real talk, stick to your plan when decline phases try to mess with your head). The folks at Top Wealth Guide-yeah, we’re all about strategic insights on building wealth, guiding you to ride these cycles with style.