
Real estate investors—yeah, those folks with dreams of passive income just chilling in the air—are bleeding cash every year. Why? They skip the math homework and dive right in without crunching the ROI numbers. You know, the usual… relying on vibes instead of actual data. Meet expectation: dashed.
Top Wealth Guide—cue the music—thinks every investment decision should wear the armor of solid stats. Enter the ROI investment property calculator. This isn’t just another boring spreadsheet. It’s your tool to turn mind-bending financial jargon into “aha” moments that scream, “Profitable!” No more wandering into the quicksand of costly mistakes. Time to get anchored in numbers.
In This Guide
- 1 Key ROI Metrics Every Investor Should Track
- 2 Essential Investment Property Calculator Tools
- 2.1 Top Wealth Guide (TWG) Calculator
- 2.2 BiggerPockets Calculator Dominates Free Options
- 2.3 BiggerPockets Calculator Dominates Free Options
- 2.4 Spreadsheet Templates Beat Mobile Apps for Serious Analysis
- 2.5 Mobile Tools Work for Initial Property Screening
- 2.6 Advanced Features Separate Professional Tools
- 3 Step-by-Step Guide to Calculating Investment Returns
- 4 Final Thoughts
Key ROI Metrics Every Investor Should Track
Alright, let’s cut through the noise of the standard ROI formula everyone’s yapping about. The real deal? Real estate investors hitting that sweet 15% annually are tracking some key metrics that separate the pros from the amateurs.
Cash-on-Cash Return Shows Real Performance
First up-cash-on-cash return. It’s the metric that shows what your cold, hard cash is actually doing for you against what you plant upfront. Those in the know aim for an 8-12% return on cash-on-cash, but the savvy ones? They shoot higher. You figure this out by dividing the annual pre-tax cash flow by the total cash invested (don’t forget your down payment and those pesky closing costs). This cuts through all the financing fluff and shows you the real cash story on your dollars at work.
Cap Rate Reveals Property Value Independent of Financing
Then there’s the cap rate-the spotlight on your property’s performance minus the financing drama. It’s net operating income sliced by the purchase price. Markets with steady cap rates? They bring the consistency game. Cleveland’s clocking 12% cash returns-San Francisco’s sitting at 4%. Translation: where you buy could change your returns big time.
Cash Flow Beats Appreciation Every Time
Monthly cash flow? It’s the heavyweight champion over property appreciation in building wealth. Score properties that bring in $300+ a month per unit, and you’re building a reliable money stream. Appreciation’s that unpredictable cat… cool, but cash flow gives you those immediate wins. Subtract your mortgage, taxes, insurance, maintenance, and vacancy reserves from the rent-to-get the net cash flow. It’s a satisfying equation.
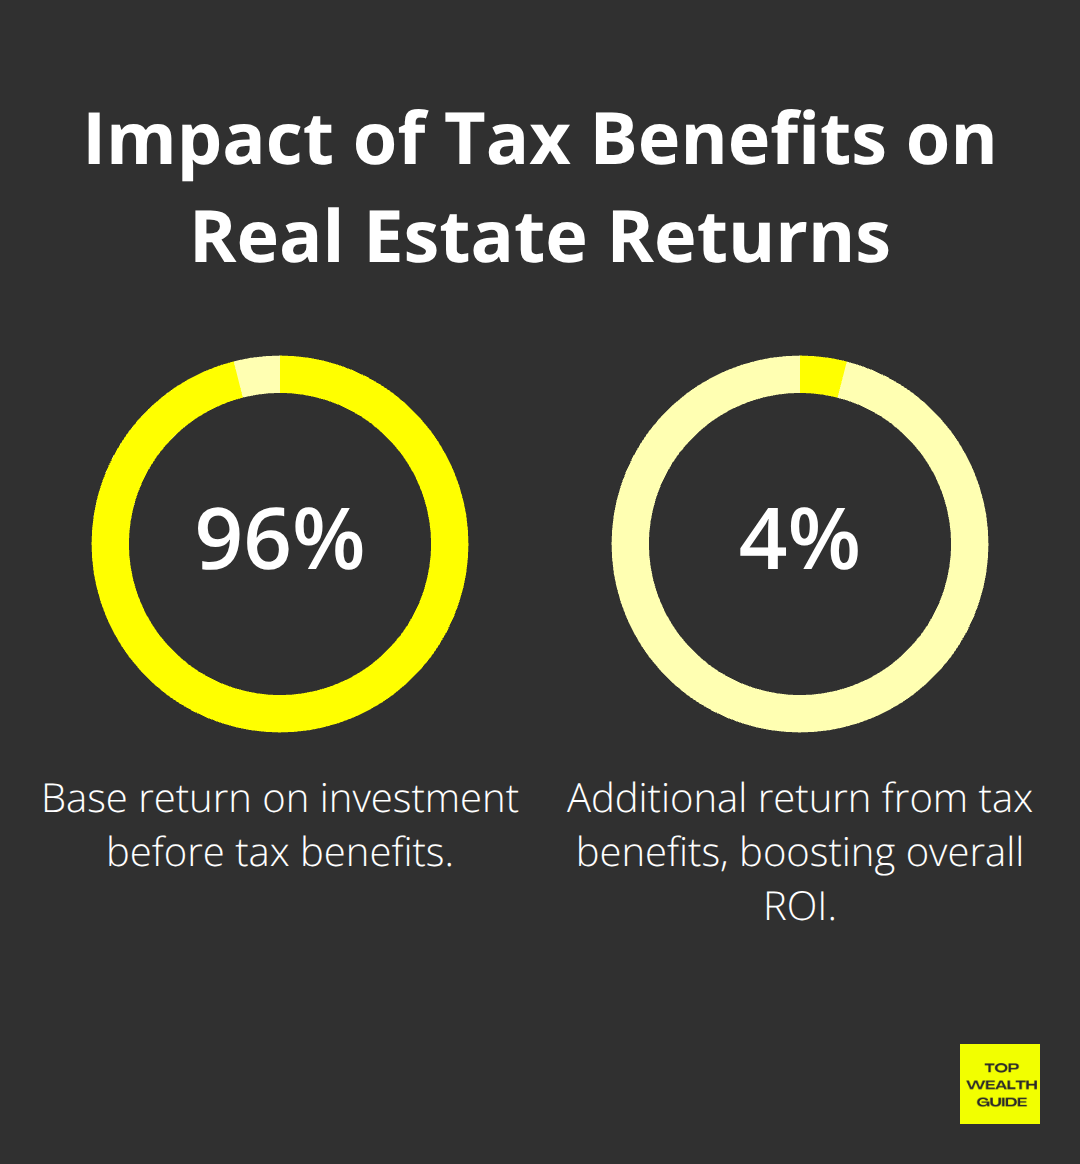
Tax Benefits Add 2-4% to Real Returns
Don’t sleep on tax benefits. Depreciation deductions alone can bump your returns by 2-4% annually. The IRS lets you take 27.5-year depreciation for residential rentals, creating some sweet paper losses to soften other income hits. Toss in mortgage interest, repairs, management fees… all those nitty-gritties slice taxable income way down. Run the numbers: A $300K rental could gift you roughly $10,900 in annual depreciation… saving you a cool $2,500-4,000 off taxes, depending on your bracket.
Put these metrics in the blender (cash-on-cash, cap rate, flow, and tax magic), and you’ve got a full investment profile. Smart money metrics give you the entire game plan before you jump in with your cash.
Essential Investment Property Calculator Tools
Top Wealth Guide (TWG) Calculator
When it comes to analyzing investment properties, affordability, or running a quick property analysis, the TWG Calculator is your go-to tool.
It’s designed with one goal in mind: simplicity and clarity. No complicated steps, no confusing jargon—just a straightforward, easy-to-use calculator that helps you make smart investment decisions with confidence.
Whether you’re figuring out how much property you can afford or evaluating a potential investment, TWG makes the process quick, accurate, and stress-free.
BiggerPockets Calculator Dominates Free Options
Friend, brace yourself… the reality’s a bit of a gut punch-most free onli
BiggerPockets Calculator Dominates Free Options
Friend, brace yourself… the reality’s a bit of a gut punch-most free online calculators are pretty much junk. BiggerPockets Calculator is breaking the mold here-it factors in the crucial stuff like vacancy rates, cap ex reserves, and real-deal financing scenarios. Half of you are spending ages on Zillow’s no-frills calculator that, guess what, misses a ton of your expenses.
The BiggerPockets gig-it’s gonna make you plug in those not-so-fun but very real maintenance costs, property management fees, and insurance premiums. Go premium with them, and you get Monte Carlo simulations showing you the possible dance of your returns across different market conditions. Real estate hotshots give it two thumbs up over the dull generic tools because it wraps appreciation, tax benefits, and cash flow into one tight package.
Spreadsheet Templates Beat Mobile Apps for Serious Analysis
Listen up-spreadsheet templates, they’re the MVPs here, schooling mobile apps left and right when it’s crunch time. The NREI template from National Real Estate Investor is packing depreciation schedules, loan amortization tables, sensitivity analysis-stuff these app-tossers don’t even consider.
If you can flex in Excel, you’re looking at modeling 30-year scenarios with rent hikes, expense spikes, and refinancing moves. Google Sheets is awesome for teaming up with partners or advisors (bonus: it’s on the house and you can access it anywhere). Ditch the cute mobile apps-they’re a quick pit stop at best, not a full-blown pit crew for your investments.
Mobile Tools Work for Initial Property Screening
Roofstock’s got a mobile calculator that’s solid for first-line screening, but trust me, their web platform’s where you get the juicy details needed for real due diligence. Mobile apps are gold for quick property checks when you’re out pounding the pavement or checking out open houses.
Wise folks use hefty spreadsheets for the final cut after mobile magic spots the gems. It’s a time-saver tag team: mobile for quick swipes, desktop for big calls.
Advanced Features Separate Professional Tools
Here’s the line in the sand-pro calculators are loaded with features basic tools don’t even dream of. Debt service coverage ratios, internal rate of return calcs, tax impact models… these are the playground of the pros, not just weekend explorers (sometimes they totally earn the extra cost).
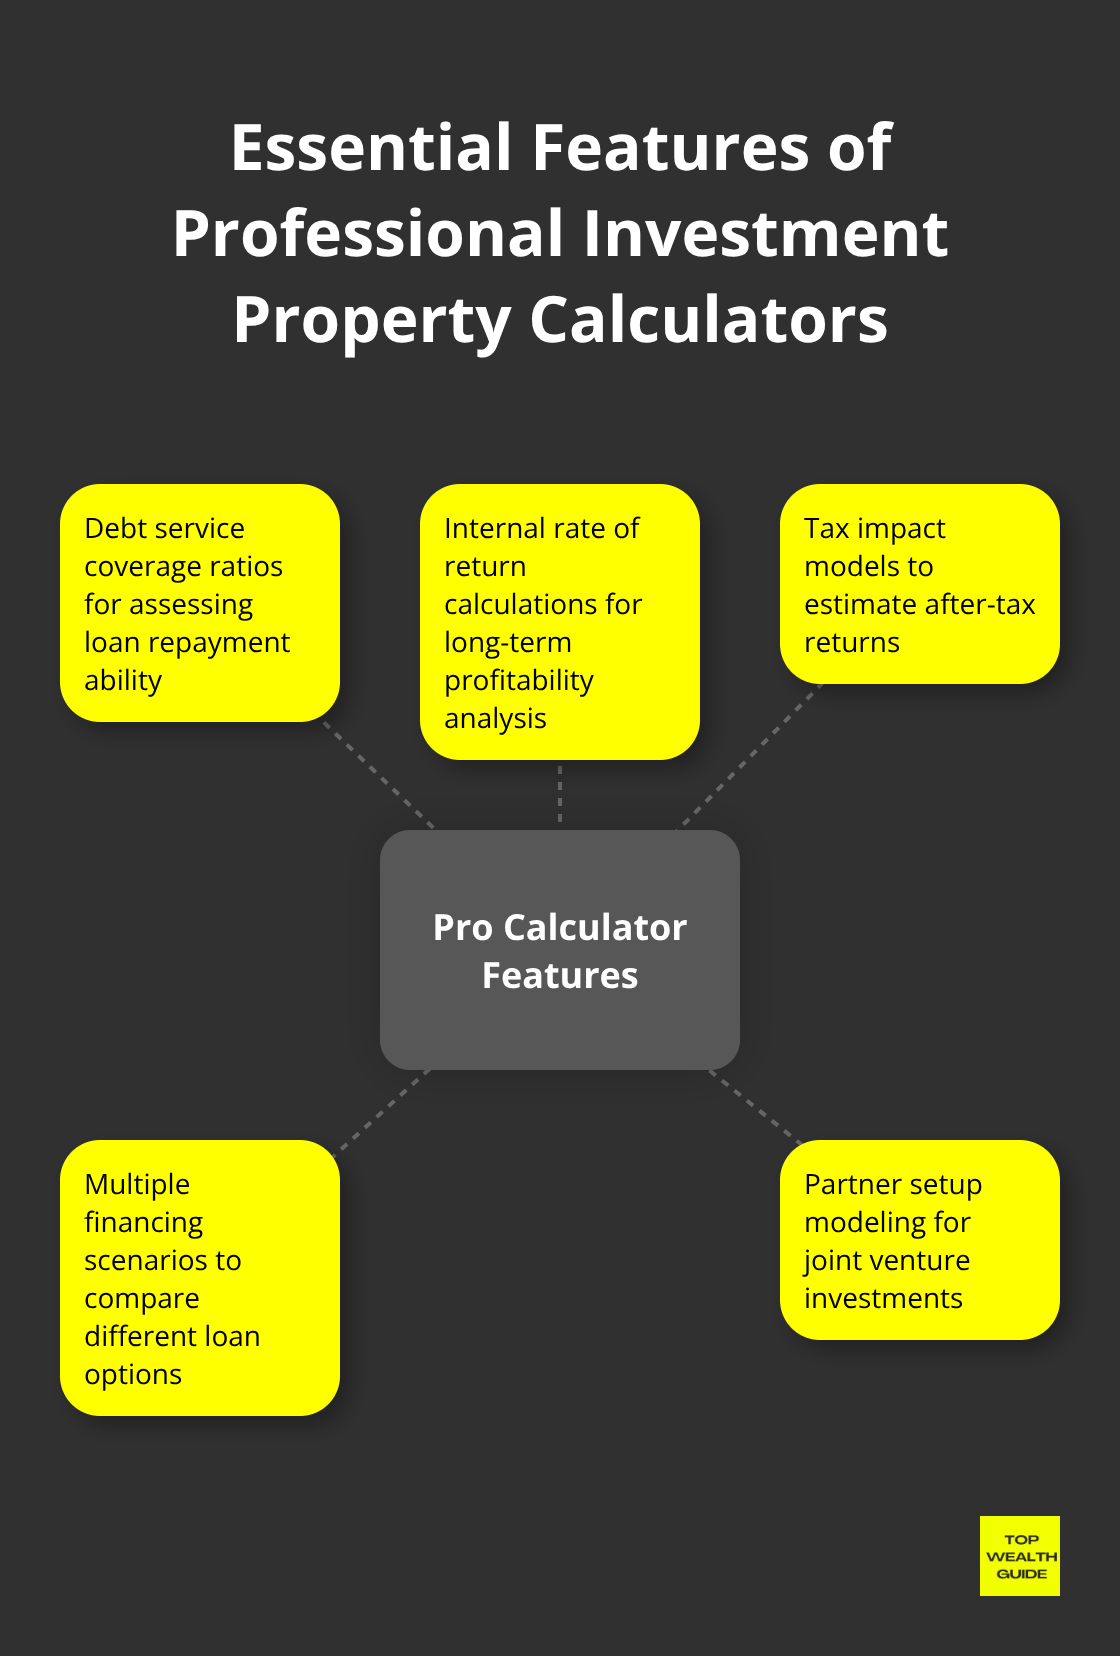
Hunt for tools that juggle multiple financing paths, partner setups, and exit plans. When you’re thinking beyond single-family homes into major project territory, these features are not just nice-to-have-they’re essentials. Before any big money moves, figure out if you can afford an investment property and scout those specialized investment property loan calculators for number-crunching your financing.
Now, you’ve got the skinny on which tools nail the calculations, next up-gathering the right intel to feed these calculators.
Step-by-Step Guide to Calculating Investment Returns
Gather Accurate Financial Data First
Here’s where most investors faceplant-data collection, folks. Start with the nitty-gritty: purchase price. Then, tack on those closing costs, 2-3% of property value, says Freddie Mac. And taxes? They hit you like a Mack truck-Illinois demands steep rates, while other states whisper sweet nothings comparatively. Insurance is the kicker-coastal spots bleed you 3-5 times more than those chill, inland areas.
Set aside 1-2% of the property value yearly for maintenance reserves. The real kicker? Neighborhood vacancy rates mean more than city stats-Columbus shouts 8% vacancy, but zip codes dance between 3% and 15%. Data like this separates the moguls from the novices.
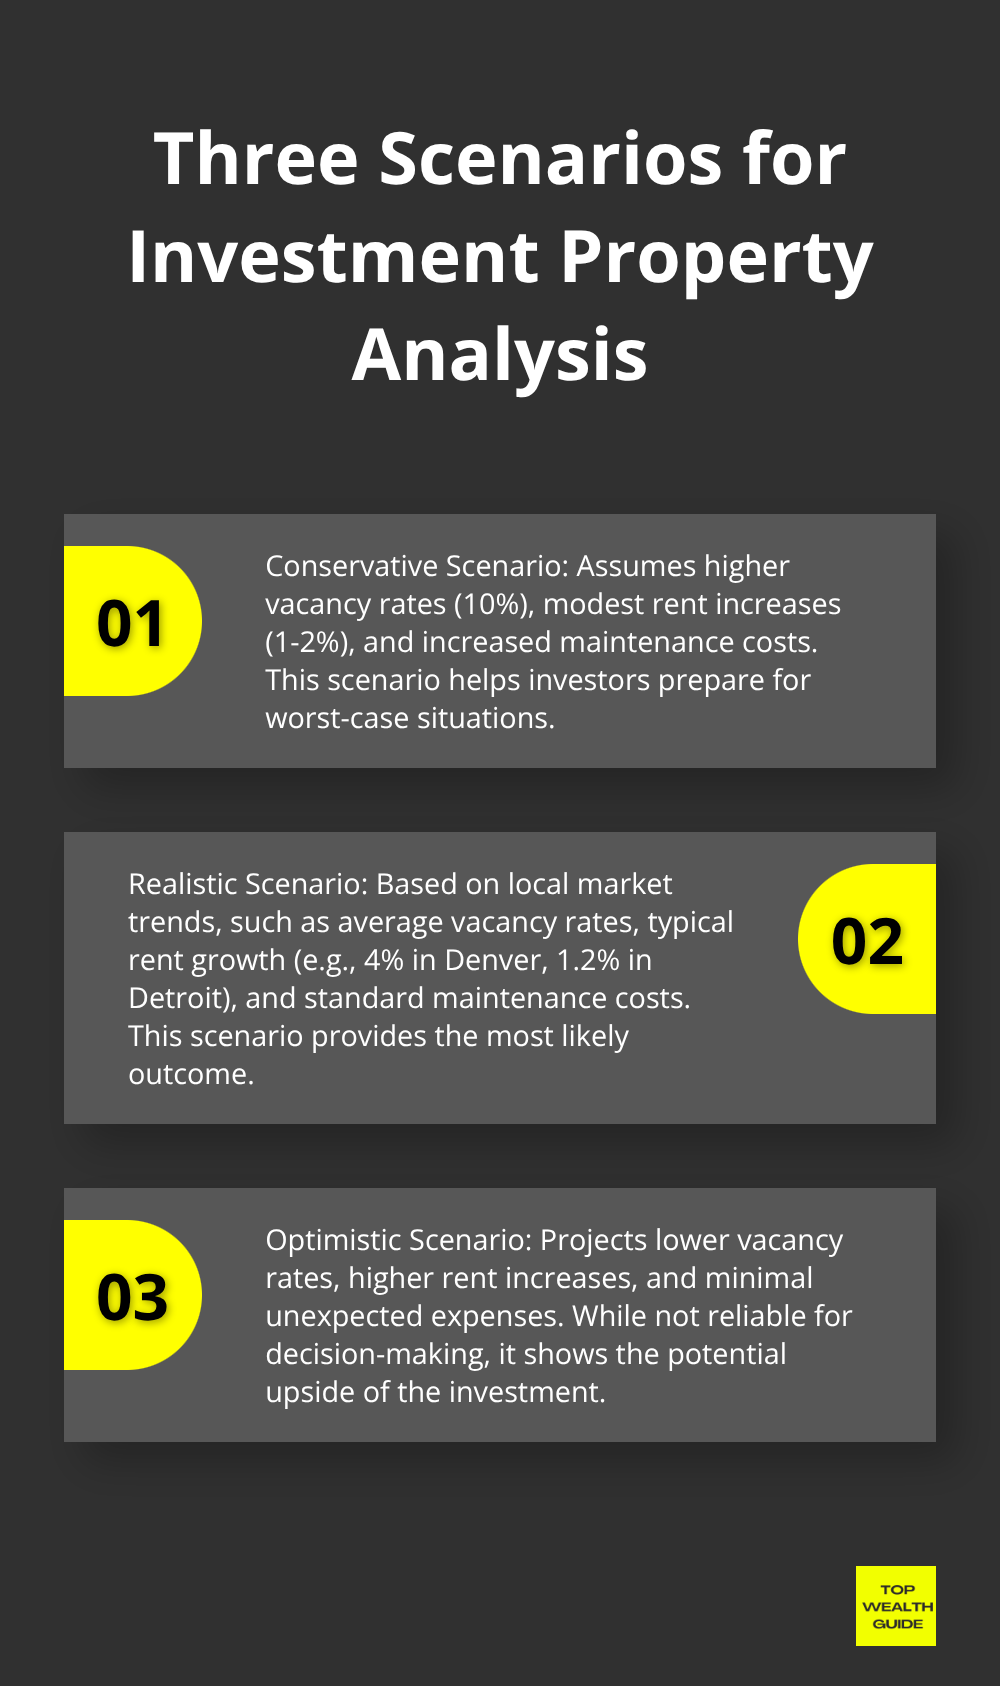
Run Multiple Investment Scenarios
Savvy investors don’t leave stones unturned-three scenarios, minimum: conservative, realistic, optimistic. Conservative’s all like: 10% vacancy, 2.5% rent hikes, jacked-up maintenance. Realism roots itself in local vibes-Denver’s at 4% rent growth, while Detroit’s limping at 1.2%. Optimistic is for daydreamers-never lay your destiny on it, though.
Interest rates? Don’t sleep on them. A 1% uptick on a $300k mortgage? That’s $1,800 more annually. Run numbers predicting a 2-3% hike, because mortgage rates swing wildly.
Interpret Results to Identify Winners
Cash-on-cash below 6%? Raise the red flag. Cap rates under 4% only jive in spots like San Francisco, Manhattan-where dreams are made, and wallets are emptied. Monthly cash flow per unit should clear $200 after expenses, or you’re playing ‘Appreciation Roulette.’
Total ROI-cash flow, appreciation, tax wins-should dance between 12-15% annually for a solid play. Seeing red cash flow past two years? Recovery is fantasy land. Knowing average rates of return benchmarks your investment game. Trust the numbers-they spill the tea without any biases.
Final Thoughts
Let’s break this down-ROI investment property calculators are basically your crystal ball in real estate. They’re turning a wild guessing game into something more like chess with dollar signs. How? By using cash-on-cash returns, cap rates, and monthly cash flow metrics to help investors identify the winners from the losers. For those just dipping their toes in the real estate pool, BiggerPockets Calculator is like training wheels. Want the big guns? Dust off those Excel spreadsheets to tinker with complex scenarios.
Starting out? Stick with free online calculators to get your feet wet-no need to complicate things. But if you’ve been around the block… invest in pro tools that juggle various finance scenarios and tax effects (they pay for themselves by not screwing up the numbers). The trick? Think conservative, realistic, and sprinkle in some optimism to anticipate all the “what ifs.”
Here’s the golden rule-success hinges on gathering bulletproof data and not fooling yourself about those vacancy rates. Zero in on properties offering a 12-15% total ROI and a monthly cash flow that’s not just in the black, but positively glowing. Partnering with Top Wealth Guide unveils data-driven decisions-priceless for building wealth that doesn’t just last… it grows.