
Investment property returns—yeah, they’re the make-or-break factor for any real estate gig. Miss the mark on your calculations, and bam… you’re likely sinking instead of swimming.
At Top Wealth Guide, we cut through the confusion with the must-know formulas and approaches. We’re talking cash-on-cash returns, cap rates, and all that jazz—along with the go-to calculator for nailing your investment property analysis.
In This Guide
What Are the Core ROI Metrics That Matter
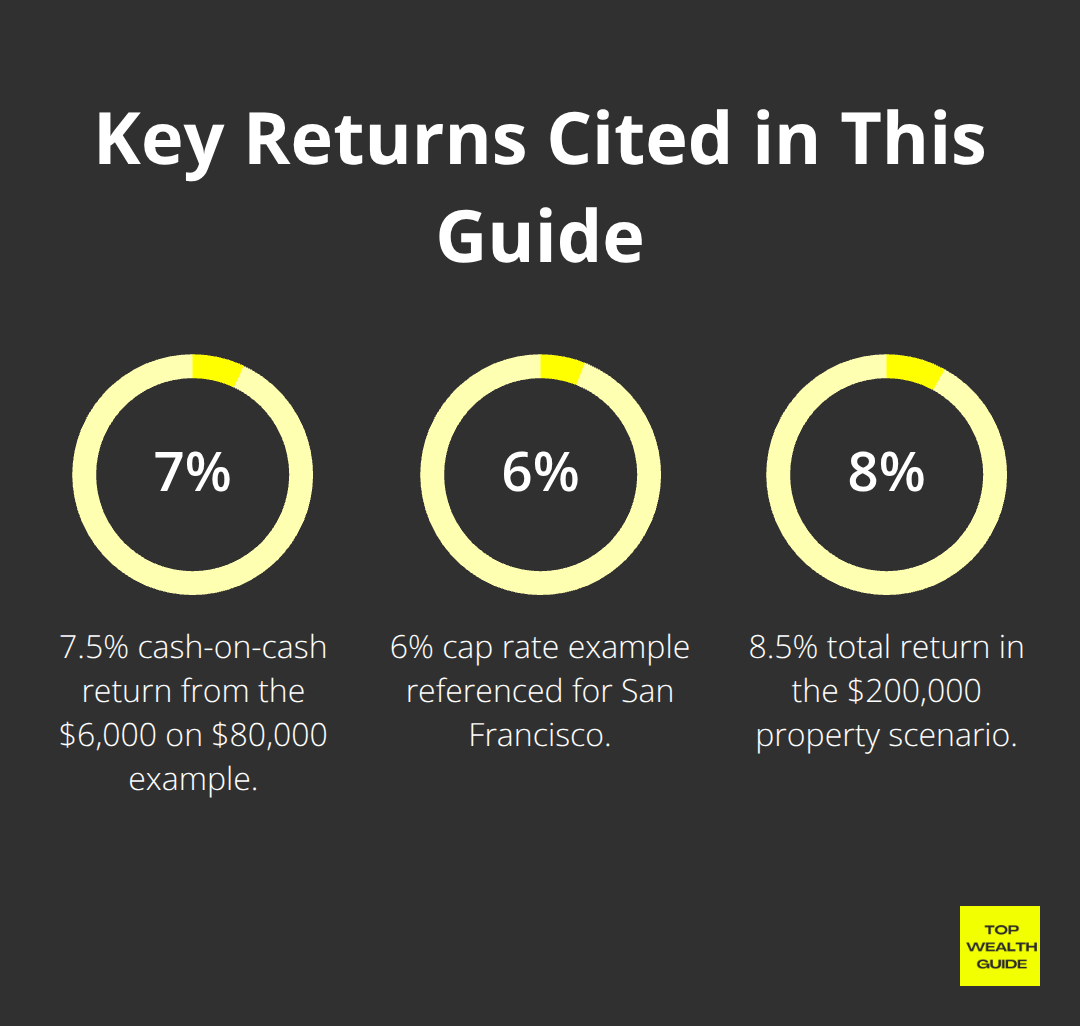
Alright, folks, listen up-cash-on-cash return, that’s the real deal when it comes to sizing up rental property performance. This little gem is all about dividing your annual pre-tax cash flow by what you’ve sunk into the thing (yeah, I’m talking down payment, closing costs, initial repairs…the whole shebang). So, you got a property turning out $6,000 a year after covering the bases? And you pumped in $80,000 to get it going? That gives you a tidy 7.5% cash-on-cash return. Now, if you’re a battle-hardened investor, you’re eyeing 8-12% minimum-though, hey, places like Austin or Nashville might twist your arm into settling for 6-8% if you want something primo. This metric? It lays bare what your cold, hard cash churns out each year.
Cap Rate Reality Check
Hop onto the cap rate train-it’s about dividing net operating income by property value. But here’s the kicker, savvy investors see it as a market yardstick, not a buy-now button. A 6% cap rate in San Fran? Cool, that’s par for the course, but the same number in Cleveland? Red flags waving! The National Association of Realtors scopes out economic and demographic landscapes, even commercial market vibes. Cap rates are your compass for spotting overblown markets and those hidden gems-but don’t put all your chips on this one, alright?
Total Return Integration
Next up, we’ve got total return-the complete package! It’s your cash flow, principal paydown, and appreciation all rolled into one snazzy number. So, take a $200,000 property-it’s spinning off $8,000 in annual cash flow, helping you chip away $3,000 off your principal, plus you’re raking in $6,000 in appreciation. All told, we’re talking an 8.5% total return. Now, in the Great Recession days, homeownership fell from 69% to 67.3%-ouch-and house prices took a nosedive. Do yourself a solid-crunch total return numbers monthly with actual rental intake, mortgage slips, and fresh market valuations, not pie-in-the-sky guesses.
Advanced Metrics for Serious Investors
For the serious players, IRR (Internal Rate of Return) is your ace in the hole-it measures your annualized total return over the whole haul, factoring in the time value of money. Way above your humble ROI, this one’s what the pros use to compare yummy investment pies, shooting for 15-20% on rental digs. It’s not for the faint of heart, though-you need something like specialized software or financial calculators to crack this nut, but, man, does it give you gold for portfolio moves.
Now you’ve got the lowdown on these core metrics, step it up-dive into the nitty-gritty of crunching the numbers with real financial data and the tools that have stood the test.
How Do You Actually Calculate Property ROI
Where the rubber really hits the road, folks, is when you gather those nitty-gritty numbers. First, grab your HUD-1 settlement statement, property tax records, insurance declarations, and every single repair receipt from the last year. Your purchase price, closing costs, and initial renovation expenses form your total cash investment base. Boom-there’s your starting point.
Essential Document Collection
Get surgical with your tracking: monthly rental income, those pesky vacancy periods, property management fees, maintenance costs, insurance premiums, and property taxes. Detail is your friend here (and the IRS kind of demands it too). Tools like QuickBooks or specialized software like Stessa? Lifesavers. They auto-categorize rental property expenses and spit out cash flow reports, saving you precious hours each month and cutting down tax season errors. Love it.
Smart Calculator Selection and Setup
Forget those basic online calculators-head straight for the ones that handle multiple scenarios like a champ. BiggerPockets offers a rental property calculator that digs into appreciation, tax benefits, and cash flow projections over time. Input all your details: actual purchase price, down payment, loan terms, estimated rental income, and operating expense ratio (most seasoned folks kick off with the 50% rule, meaning operating expenses typically gobble up half your rental income). Adjust this based on property age and local market nuances. Got it?
Income and Expense Tracking That Actually Works
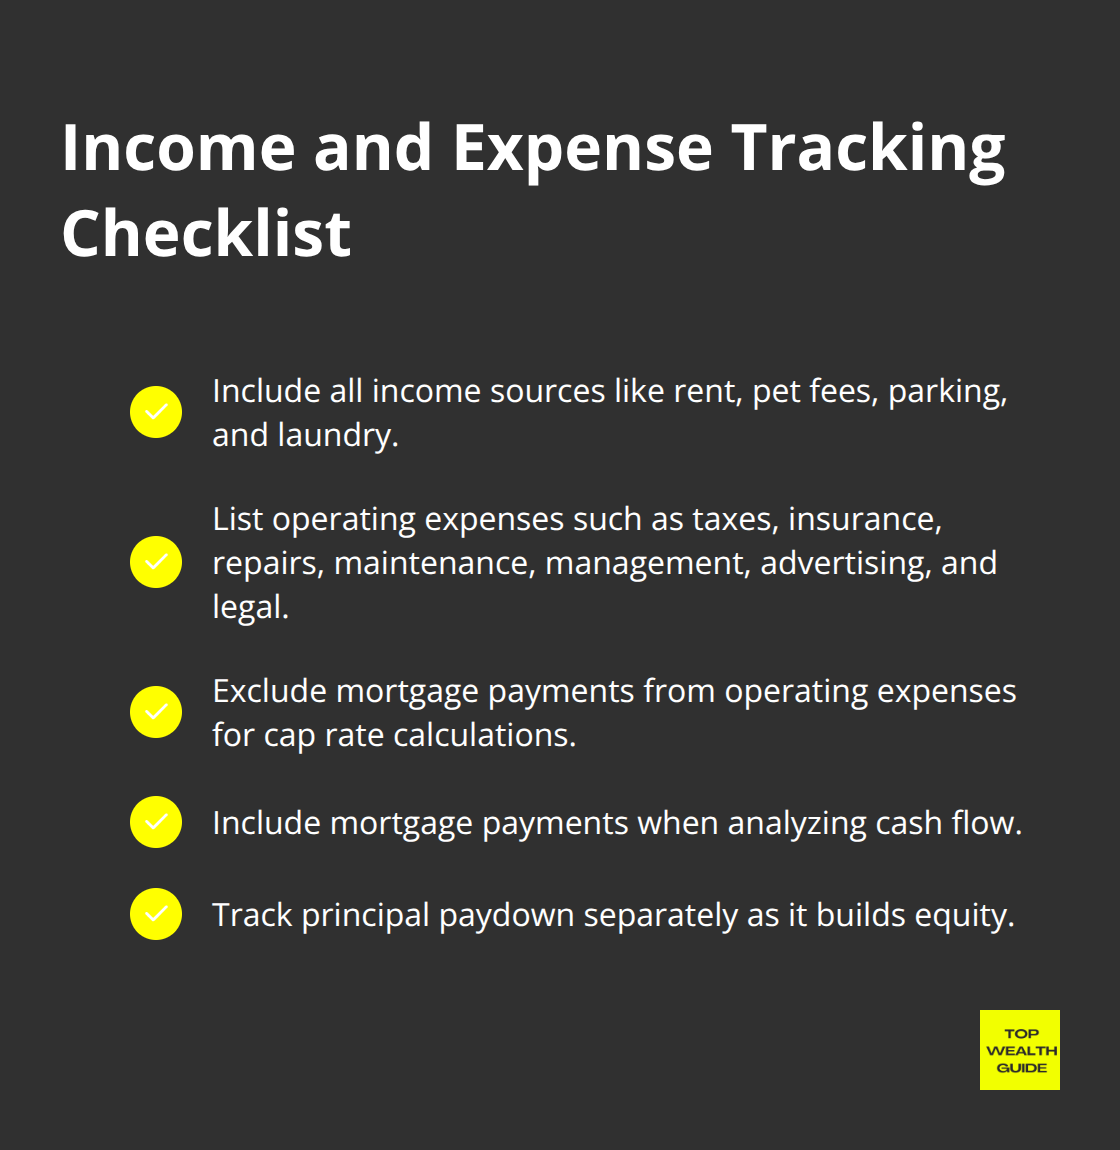
Here’s the drill: your gross rental income includes base rent, pet fees, parking charges, and even laundry income if you’ve got it. Subtract your operating expenses-property taxes, insurance, repairs, maintenance, property management fees, advertising costs, legal fees. Important note: exclude mortgage payments in operating expenses when calculating cap rates, but definitely include them for cash flow analysis. Track principal paydown separately because it builds equity, even though it hits your monthly cash flow.
Advanced Analysis Techniques
Dive into sensitivity analyses and tweak those vacancy rates and maintenance costs based on property specifics and local market vibes. Property depreciation? Major tax benefits that could slash your annual tax hit. Test different scenarios-see how market shifts affect your bottom line. For more nuanced analysis, consider digging into advanced real estate investment strategies to supercharge your ROI calculations.
These calculation methods lay down the groundwork, but remember-external factors can dramatically alter your returns. Location dynamics, management choices, and tax strategies all have a significant role in your final numbers. Stay sharp!
What Factors Make or Break Your Property Returns
Real estate-it’s all about location, location, location. But let’s drill down-savvy investors, they get it-it’s not about the city, it’s about the neighborhood, the street, heck, even the block. We’re talking specifics. Like properties close to public transit within 0.5 miles in places like Denver and Seattle, those babies are gold mines. Transit premium, people. It pumps up property values. And let’s not forget school districts-yep, those correlate directly with your tenant quality. Top-notch schools equal lower vacancy rates-about 40% less, compared to your run-of-the-mill districts.
Now, job growth-that’s the real tea. Take Austin, for instance-adding 47,000 gigs in 2023, it’s a rental demand bonanza. Meanwhile, poor Detroit lost 12,000 jobs-hello, oversupply chaos. Diversity in employment-track it. Cities tethered to just one industry, like oil or tech? They’re like roller coasters in rental income when the economy throws a curveball.
Property Management Costs That Kill Returns
Property management fees-6-12% of gross rental income. But a deal that looks too good? Probably isn’t. Professional managers are worth their weight in gold-faster tenant swaps, thorough screening. Maintenance? Budget 1-2% of property value every year-go high for those older gems.
Seasoned pros pour $150 per unit monthly for maintenance if the building’s over 20-and for new pads, you’re looking at $75. Repairs knock rudely at the tune of $2,400 on average yearly, per property says the National Association of Residential Property Managers. Forget perfect cap rates, stash those cash reserves.
Tax Benefits That Boost Real Returns
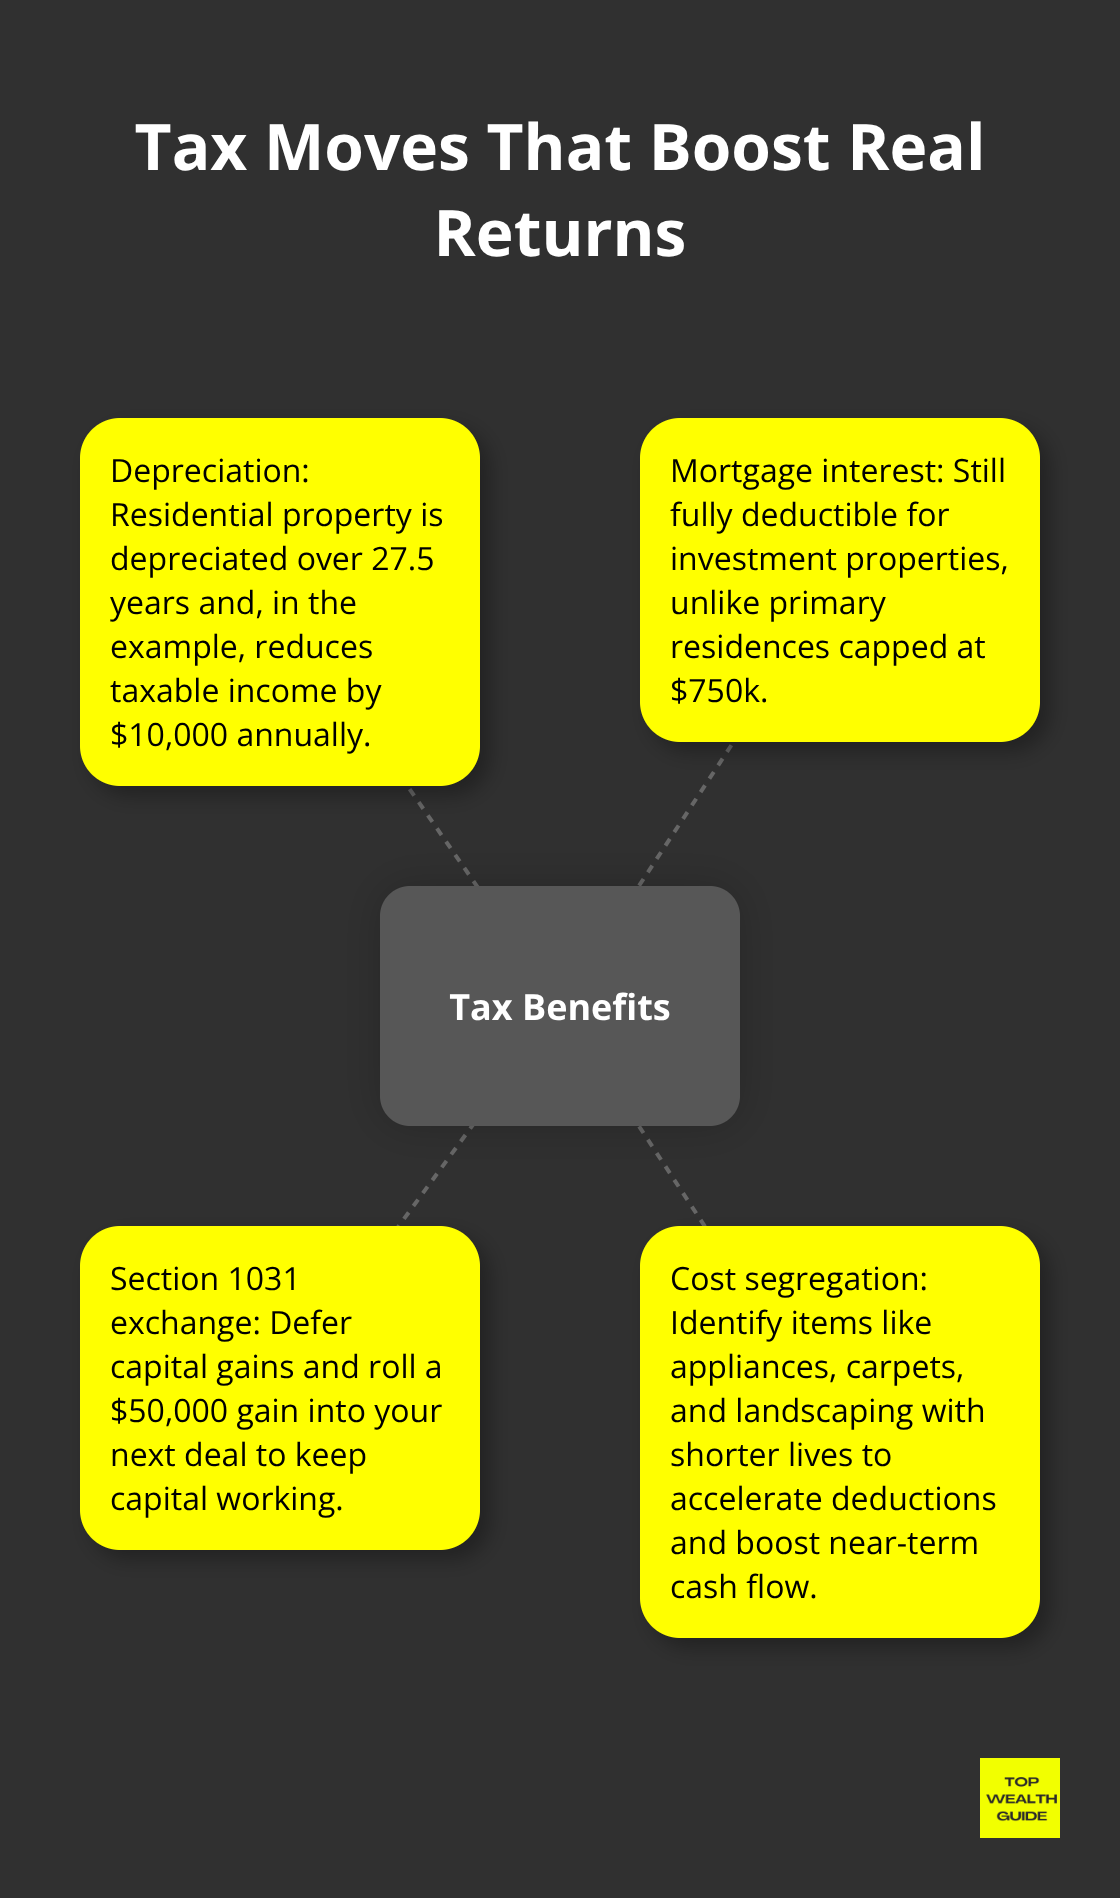
Depreciation deductions are a gift-residential properties over 27.5 years dish out-you guessed it-a deduction party. A $275,000 home’s shaving $10,000 off your taxable income annually without breaking a sweat. Mortgage interest? Still fully deductible for investment properties (unlike your personal crib, capped at $750k).
And then there’s the shining star-Section 1031 exchanges. Avoid capital gains taxes while upgrading-it turns that $50,000 gain into reinvestment mojo, not a tax nightmare. Cost segregation studies-what a mouthful-they flag items depreciating faster than 27.5 years. Stuff like appliances, carpets, and landscaping bring those sweet deductions forward, boosting cash flow when you need it most.
Final Thoughts
So, thinking about making money with investment properties? Well, it’s not a game of darts – you gotta be precise. Cash-on-cash return? That’s your real-life flashlight showing how your cash is truly performing. Then you’ve got cap rates – the crystal ball that helps you understand where you stand in the market. Total return? That’s your all-in picture – appreciation plus principal paydown. And the sharp folks? They drop IRR – a GPS for comparing different opportunities over time.
The secret sauce here is detail. Meticulous number-crunching and using the right gadgets for scrutinizing investment properties. Keep a lid on every cost, from taxes to fixing that leaky faucet. Don’t forget those pesky vacancy periods – they can munch on your profits. Tools like Stessa and BiggerPockets calculators? Lifesavers. They take the heavy lifting off your hands and help dodge those mind-numbing errors.
Real estate’s golden rule? Location, location, location. In places with transit, booming job hubs, and solid schools? Pure gold. Don’t overlook the costs of management, stash away some maintenance funds, and cheers to tax perks like depreciation deductions – they can save you a bundle. At Top Wealth Guide, it’s all about the smart moves – practical, data-backed strategies that stack up real wealth.