
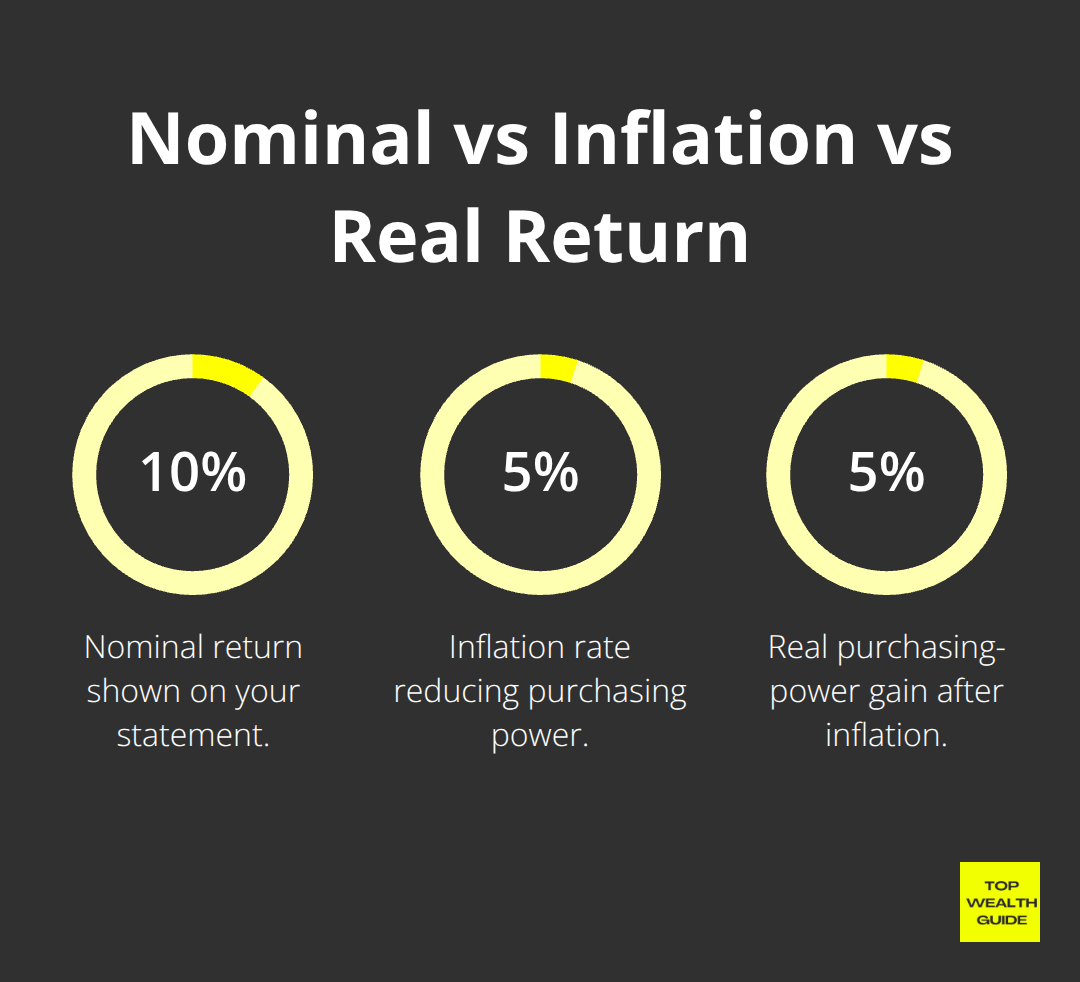
Your investment returns might look impressive on paper, but inflation is quietly eating away at your actual wealth. A 10% annual return means nothing if prices rise 5%-you’re only gaining 5% in real purchasing power.
At Top Wealth Guide, we show you how to strip away the inflation illusion and see what your investments truly earn. This guide walks you through the exact calculations and strategies that separate real wealth growth from misleading numbers.
In This Guide
What’s Really Happening to Your Returns
When you see a 10% investment return advertised or displayed in your portfolio statement, that number tells only half the story. That 10% is your nominal return-the raw percentage gain before life’s reality sets in. During 2022, when inflation hit 8.0%, many investors celebrated nominal gains of 6% to 8% on bonds and savings accounts, only to realize they’d actually lost purchasing power. Your real return is what matters for your actual wealth, and it’s almost always lower than the number you see on your statement. The gap between nominal and real returns widens dramatically during high-inflation periods, which is precisely when most people stop paying attention to it.
Why Your Bank Statement Lies to You
A savings account paying 4.5% sounds reasonable until inflation erodes 3.5% of that gain. You’re left with a real return of just 1%, yet your bank advertises only the 4.5% number. This deception matters enormously over time. If you kept $100,000 in cash earning 4.5% annually with 3.5% inflation for 10 years, your nominal balance would reach approximately $155,634. But in today’s purchasing power, that’s only worth about $121,400-far less impressive. Taxes make this worse. A 5% nominal return in a taxable account at a 24% tax rate drops to 3.8% after taxes, then falls further when inflation is subtracted. Most people never perform this math, which is why they feel perpetually disappointed with their investment results.
Real Returns Reveal Your True Wealth Growth
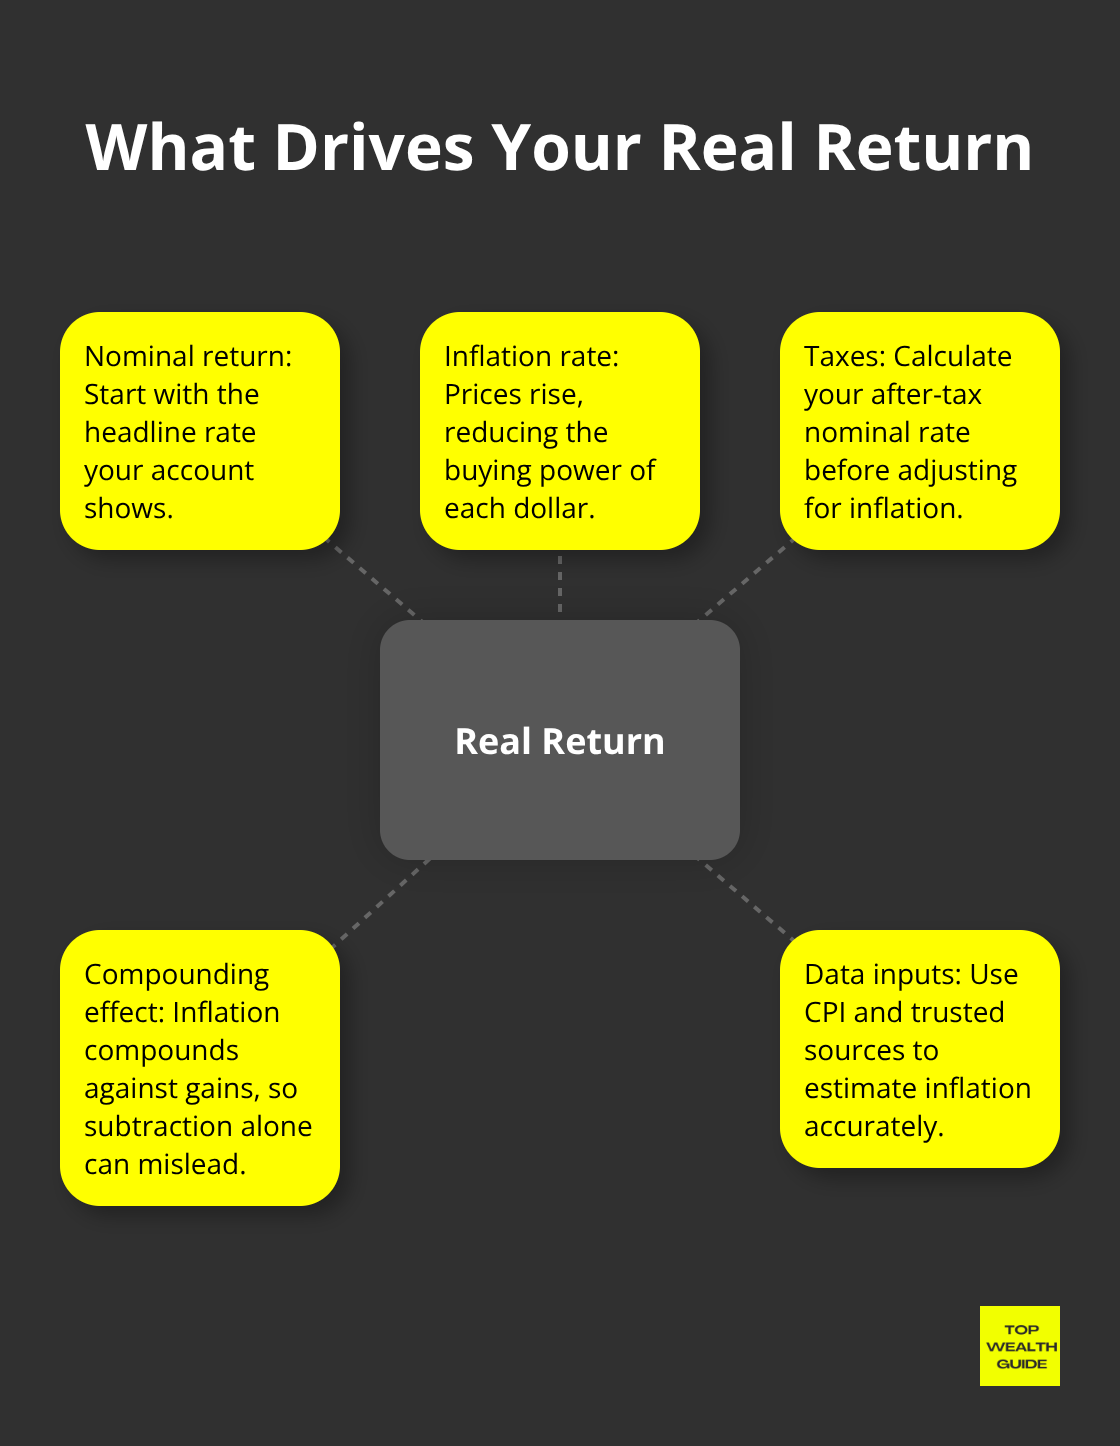
Real return is simply your nominal return minus inflation, adjusted for taxes. The real return calculation formula used by economists is straightforward: Real Return equals (1 + Nominal Rate) divided by (1 + Inflation Rate), then subtract 1. Take a concrete example: a stock investment returning 12% nominally with 4% inflation and 20% taxes yields a real return of roughly 6.4% after accounting for both factors. This real number reflects actual purchasing power gained. Understanding this difference transforms how you evaluate your portfolio entirely. You stop chasing headline-grabbing nominal returns and instead focus on investments that genuinely expand your purchasing power year after year.
How Inflation and Taxes Compound the Problem
Inflation doesn’t just reduce your returns once-it compounds against you repeatedly. A 2% real return over 30 years still builds wealth, but a negative real return (when inflation exceeds your nominal gains) actively destroys it. Your tax bill amplifies this damage. The formula to calculate your after-tax nominal rate is: Nominal Rate × (1 − Tax Rate). A 10% nominal return at a 30% tax rate becomes 7% after taxes. Then you subtract inflation. If inflation runs at 5%, your real return drops to roughly 1.9%-a dramatic difference from the original 10% headline number. This is why high-inflation periods expose the weakness in portfolios that ignore real returns. The math compounds against you, and most investors don’t realize it until years have passed.
Moving From Numbers to Action
The real return calculation matters most when you compare different investments or plan for long-term goals. A bond paying 5% nominal with 3% inflation yields a 2% real return. A stock fund averaging 8% nominal with the same 3% inflation produces a 4.9% real return-nearly 2.5 times better in real terms. These differences determine whether you’ll have enough money in retirement or fall short. The Consumer Price Index and Federal Reserve Bank of St. Louis provide the data you need to perform these calculations accurately. You can apply this formula to any investment-stocks, bonds, real estate, or cash-to see what it truly earns. Once you start thinking in real returns, you’ll notice that many “safe” investments actually lose purchasing power, while diversified stock portfolios historically outpace inflation significantly. This shift in perspective is what separates investors who build lasting wealth from those who watch their money slowly erode.
The Real Return Formula You Actually Need
Understanding the Fisher Equation
The Fisher Equation stands as the gold standard for calculating real returns, and it’s far simpler than its academic reputation suggests. The formula is: Real Return = (1 + Nominal Return) ÷ (1 + Inflation Rate) − 1. This method accounts for how inflation compounds against your gains, which basic subtraction misses. Take a practical scenario: you earned 12% nominally on a stock investment while inflation ran at 3%. Using the Fisher Equation, your real return is (1.12 ÷ 1.03) − 1 = 0.0874, or 8.74%. A simple subtraction would incorrectly suggest 9%. The difference seems small until you compound it over decades.
When Inflation Spikes, Reality Hits Hard
When inflation rises significantly, the gap between nominal and real returns widens dramatically. During 2022, when inflation peaked at 8.0%, many investors thought their 10% nominal bond returns were solid. The Fisher Equation revealed the truth: (1.10 ÷ 1.08) − 1 = 0.0185, or just 1.85% real return. Taxes destroy this further. You must calculate your after-tax nominal return first using Nominal Rate × (1 − Tax Rate), then plug that number into the Fisher Equation. A 10% nominal return at a 24% tax rate becomes 7.6% after taxes. With 3% inflation, your real return drops to (1.076 ÷ 1.03) − 1 = 0.0447, or 4.47%. This is why high-income earners in taxable accounts often underperform despite decent nominal gains.
Why Savings Accounts Fail to Build Wealth
Real return calculations reveal why certain investments fail to build wealth. A savings account earning 4.5% with 3.5% inflation and 24% taxes yields (1.0342 ÷ 1.035) − 1 = −0.0008, or negative 0.08% real return. You’re actually losing purchasing power. Compare this to a diversified stock portfolio averaging 8% nominal with the same inflation and tax rate: (1.0608 ÷ 1.035) − 1 = 0.0255, or 2.55% real return. Over 30 years, $100,000 invested in stocks grows to roughly $210,000 in today’s dollars, while that same amount in savings accounts grows to only $102,000 in today’s dollars.
Planning With Realistic Inflation Assumptions
Historical inflation data from the Federal Reserve Bank of St. Louis lets you calculate real returns for past investments. For forward-looking planning, try using the long-run average inflation rate of 3% to 3.5% unless you have specific reasons to expect different. Many investors use 5% nominal stock returns as their real return assumption, which is dangerously optimistic. Subtract 3% for inflation and you’re left with 2% real growth, not 5%. This realistic view prevents overconfidence and forces you to save more aggressively if you want to hit retirement targets.
Applying Real Returns Across Your Portfolio
The Fisher Equation works for any investment you own. Stocks, bonds, real estate, or cash-each asset class produces a real return that either builds or erodes your purchasing power. Once you start calculating real returns for your actual holdings, you’ll notice patterns that nominal returns hide. A bond paying 5% nominal with 3% inflation yields a 2% real return. A stock fund averaging 8% nominal with the same 3% inflation produces a 4.9% real return-nearly 2.5 times better in real terms. These differences determine whether you’ll have enough money in retirement or fall short. The next section shows how different asset classes perform when you strip away inflation’s illusion and examine their true wealth-building power.
How Different Investments Actually Perform After Inflation
Stocks Deliver Superior Real Returns Over Decades
Stocks have historically delivered the strongest real returns among major asset classes. From December 1986 to January 2026, a $10,000 investment in VFINX (Vanguard’s S&P 500 fund) grew to approximately $201,613 in 2026 dollars when adjusted for inflation and with dividends reinvested. That represents a real annualized return of roughly 6.8% to 7.0% per year over nearly 40 years, according to historical real returns of stocks over 40 years. In 2025 alone, VFINX gained 14.39% nominally, which translates to approximately 11.7% in real terms after the 2.68% year-over-year inflation measured through November 2025. Stocks don’t just beat inflation-they substantially outpace it across long holding periods. This performance comes with volatility, however. The 2008 financial crisis produced a real drawdown of approximately 58% for stocks, meaning investors needed patience and discipline to capture those long-term gains.
Bonds Stabilize Portfolios but Lag in Real Growth
Bonds provide stability but weaker real returns than stocks. VBMFX (a bond fund) gained only 3.67% in 2025 and experienced a real drawdown during the 2009 crisis. A bond paying 5% nominal return with 3% inflation produces just a 2% real return-less than one-third the real return from an average stock portfolio earning 8% nominal with the same inflation. Bonds serve better as portfolio stabilizers than as primary wealth builders. Many investors mistakenly load their portfolios with bonds to feel safer, not realizing they accept permanent real losses if inflation remains elevated. The math is straightforward: bonds cannot match stock returns over time, so they should occupy a smaller role in long-term wealth plans.
Real Estate Offers Middle-Ground Returns with Complexity
Real estate occupies a middle ground between stocks and bonds, though the data is messier because real estate returns depend heavily on your specific property, mortgage terms, and local market conditions. Unlike stocks and bonds with transparent pricing and historical databases, real estate requires calculating your own returns including property appreciation, rental income, mortgage interest deductions, property taxes, maintenance costs, and vacancy rates. A property purchased for $400,000 with a 20% down payment ($80,000) that appreciates 3% annually while producing 4% net rental yield (after all expenses) generates roughly 7% to 8% real returns when leverage is factored in-potentially competitive with stocks but with significantly lower liquidity. Real estate inflation hedge works during high-inflation periods because rents typically rise with inflation while fixed-rate mortgage payments stay constant, naturally improving your real cash flow. This benefit works only if you own the property outright or have a fixed-rate mortgage; adjustable-rate mortgages eliminate this advantage entirely.
Cash Destroys Purchasing Power Over Time
Cash, held as savings accounts or money market funds, performs worst of all asset classes in real terms. A savings account earning 4.5% with 3.5% inflation and 24% taxes produces negative 0.08% real return-you’re actually losing purchasing power. Over 10 years, $100,000 in such a savings account becomes worth roughly $102,000 in today’s dollars.
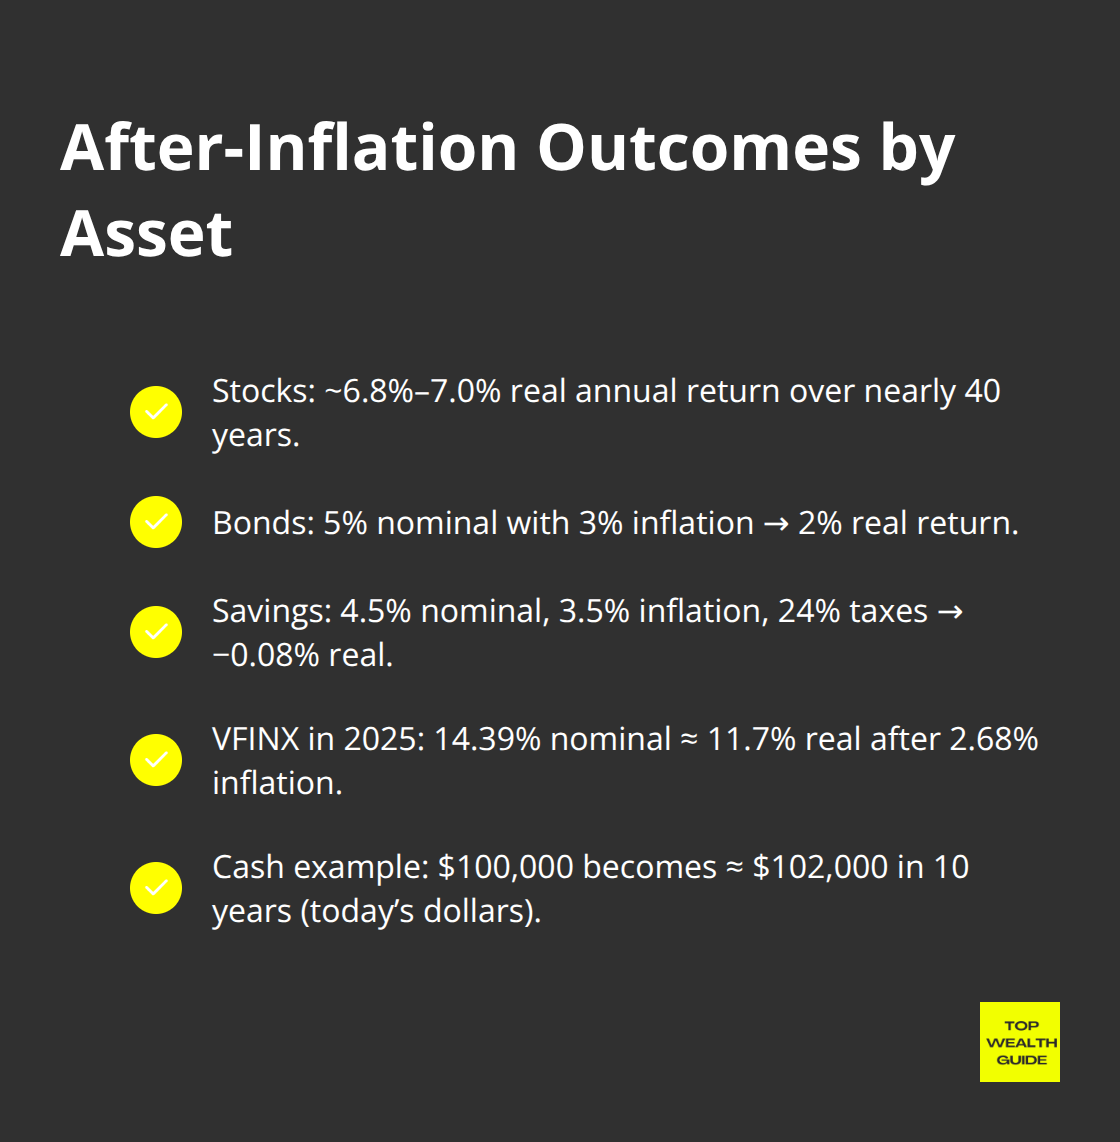
The same $100,000 invested in a diversified stock portfolio producing 8% nominal returns with identical tax and inflation rates grows to approximately $210,000 in today’s dollars. This $108,000 difference is not theoretical-it’s the actual cost of choosing safety over real wealth growth.
Building Your Real-Return Strategy
Stocks should form the foundation of any long-term wealth plan because they’re the only major asset class that consistently produces positive real returns after inflation and taxes. Bonds serve as diversifiers and reduce volatility during crashes, but they shouldn’t dominate your portfolio unless you’re within five years of needing the money. Real estate works well as a secondary wealth builder if you can manage it actively or accept the illiquidity. Cash should hold only your emergency fund and near-term expenses-nothing more.
Final Thoughts
Real investment returns are the only metric that matters for building lasting wealth. Nominal returns create an illusion of progress while inflation silently erodes your purchasing power. A 10% nominal return with 3% inflation and 24% taxes produces only 5.3% in real gains, and over 30 years this compounds into dramatically different outcomes-your stock portfolio earning 8% nominal becomes $210,000 in today’s dollars, while a savings account earning 4.5% becomes only $102,000.
Protecting your portfolio from inflation requires action, not hope. Stocks form your foundation because they’re the only major asset class that consistently outpace inflation after taxes, while bonds reduce volatility but shouldn’t dominate your allocation unless you’re near retirement. Real estate works as a secondary wealth builder if you can manage it actively, and cash should hold only your emergency fund and near-term expenses.
Start monitoring your actual investment returns today by calculating the real return on your current holdings using the Fisher Equation. Subtract inflation from your nominal returns, then adjust for taxes, and compare what you thought you were earning to what you’re actually earning in purchasing power. Visit our platform to access calculators and step-by-step strategies for building wealth that lasts.