
Most investors chase the stocks Wall Street hypes — the safe, shiny names on every newsletter and cable hit. The real returns? They live in the unloved, under-followed businesses trading below intrinsic value…and that gap is where serious wealth gets made.
At Top Wealth Guide, we hunt value stocks the institutions walk past — companies with clean fundamentals and actual competitive moats (yes, moats) that the market simply misprices. This guide shows you how to spot those disconnects — and how to turn market inefficiency into compoundable wealth.
In This Guide
What Makes a Stock Truly Undervalued
Wall Street’s research engines herd to the same spots – mega-cap names, sector darlings, the places where institutional money already naps. That leaves thousands of smaller, less-followed companies off the radar – invisible to the algorithms and sell-side scripts that set market prices. A stock becomes genuinely hidden value when three things line up: it trades well below what its future cash flows justify, big institutions ignore it because it’s outside their mandate, and the business itself isn’t collapsing – just misperceived. The delta between intrinsic value and market price – that’s where the real opportunity sits. Most of these names live in the weeds – specialty manufacturers, regional banks, niche healthcare suppliers – sectors Wall Street treats like the abandoned attic. Yahoo Finance’s undervalued-growth screener currently shows 169 stocks hitting strict filters (trailing P/E below 20, PEG under 1, earnings growth above 25%), yet only a sliver show up on institutional radars. Why? Because fund managers have rulebooks, mandates, and allocation spreadsheets – and those rules often read: “Don’t touch the weird stuff,” even when valuations scream buy.
Why Institutional Neglect Creates Mispricings
Big asset managers play by constraints – minimum market caps, liquidity floors, benchmark hugging – that auto-exclude most hidden-value candidates. A $500 million market-cap company trading at 8x forward earnings with 30% earnings growth might be a bargain – but a $10 billion fund can’t hold a position that won’t move the needle (or that creates compliance headaches). The structure of institutional investing lets pricing inefficiencies live longer in small, obscure names. Real examples make it concrete: Penguin Solutions sits at roughly 9x forward earnings with a 29.1% gross margin – headline cheap, but there are structural headwinds that demand deeper work. Meanwhile, names like CEMEX or The Mosaic Company can pop on undervalued-growth screens (PEGs well under 1, improving earnings signals), pointing to value in materials and chemicals – areas where coverage is thin. Key takeaway – cheap price alone is a hallucination unless you can show the market’s sour view is temporary, not terminal.
The Intrinsic Value Test and Margin of Safety
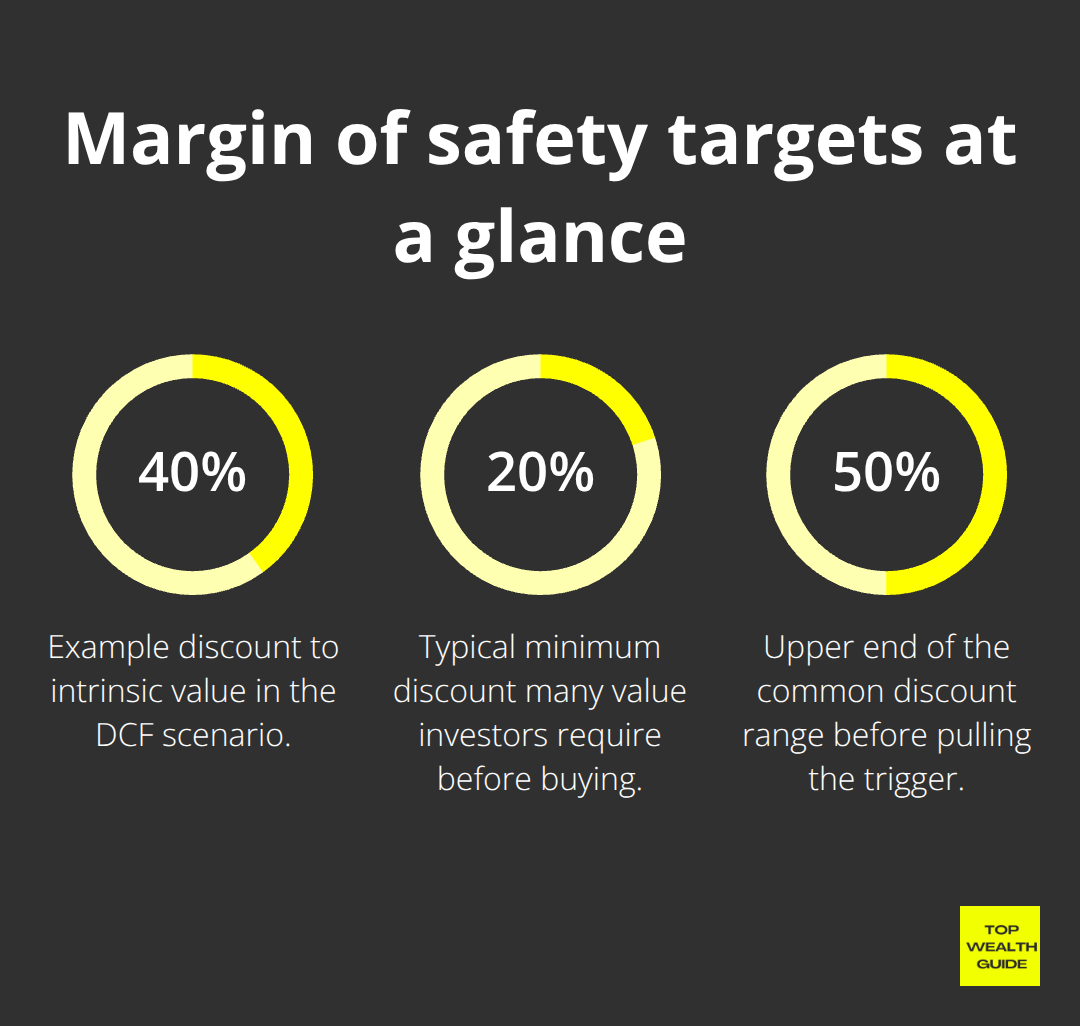
intrinsic value is just present value math – discount future free cash flows at a rate that reflects risk. Sounds academic – feels practical. Do the work: pull three years of free cash flow from SEC filings, pick a sensible growth run-rate (based on history and industry dynamics), then discount by an appropriate cost of capital. If a business throws off $10 million of annual free cash flow, you assume 5% perpetual growth and discount at 10% – you land around $200 million intrinsic value. Market price at $120 million? That’s a 40% discount – your margin of safety. That cushion is not romantic – it’s disciplined risk management. Most value people demand 20%–50% discounts before they pull the trigger. This isn’t guesswork; it’s a defense against model blow-ups and unlucky black swans.
And remember: an 8x earnings multiple looks juicy until you discover normalized free cash flow margins are imploding (see Sirius XM’s eroding return on invested capital). Conversely, a company with 15% free cash flow margins, steady growth, and little leverage can justify a 15x multiple – despite headline “expensive” labels.
How to Separate True Bargains from Value Traps
Hidden value only surfaces when you separate bargain from trap – and that requires brutal, granular analysis. Penguin Solutions is a caution: cheap at 9x forward earnings, yes – but sales have slid ~2.5% annually over the last two years, margins sit below peers (29.1% gross), and free cash flow margins are ~6.2% – which limits reinvestment or shareholder returns. Cheapness here masks structural decay, not a temporary oversight. Calavo Growers is another: roughly 11x forward earnings but a 17.2% annual revenue decline over three years; a 10.1% gross margin that screams commoditization and pricing stress. Sirius XM trades at about 6.8x forward earnings, but subscriber growth is weak and revenue flat. These cases show low multiples often coincide with real headwinds. The right play: dig into revenue trajectories, margin durability, free cash flow quality, ROIC, and competitive positioning – do that work and you filter the winners from the wealth-destroyers.
Building Your Hidden Value Screening Process
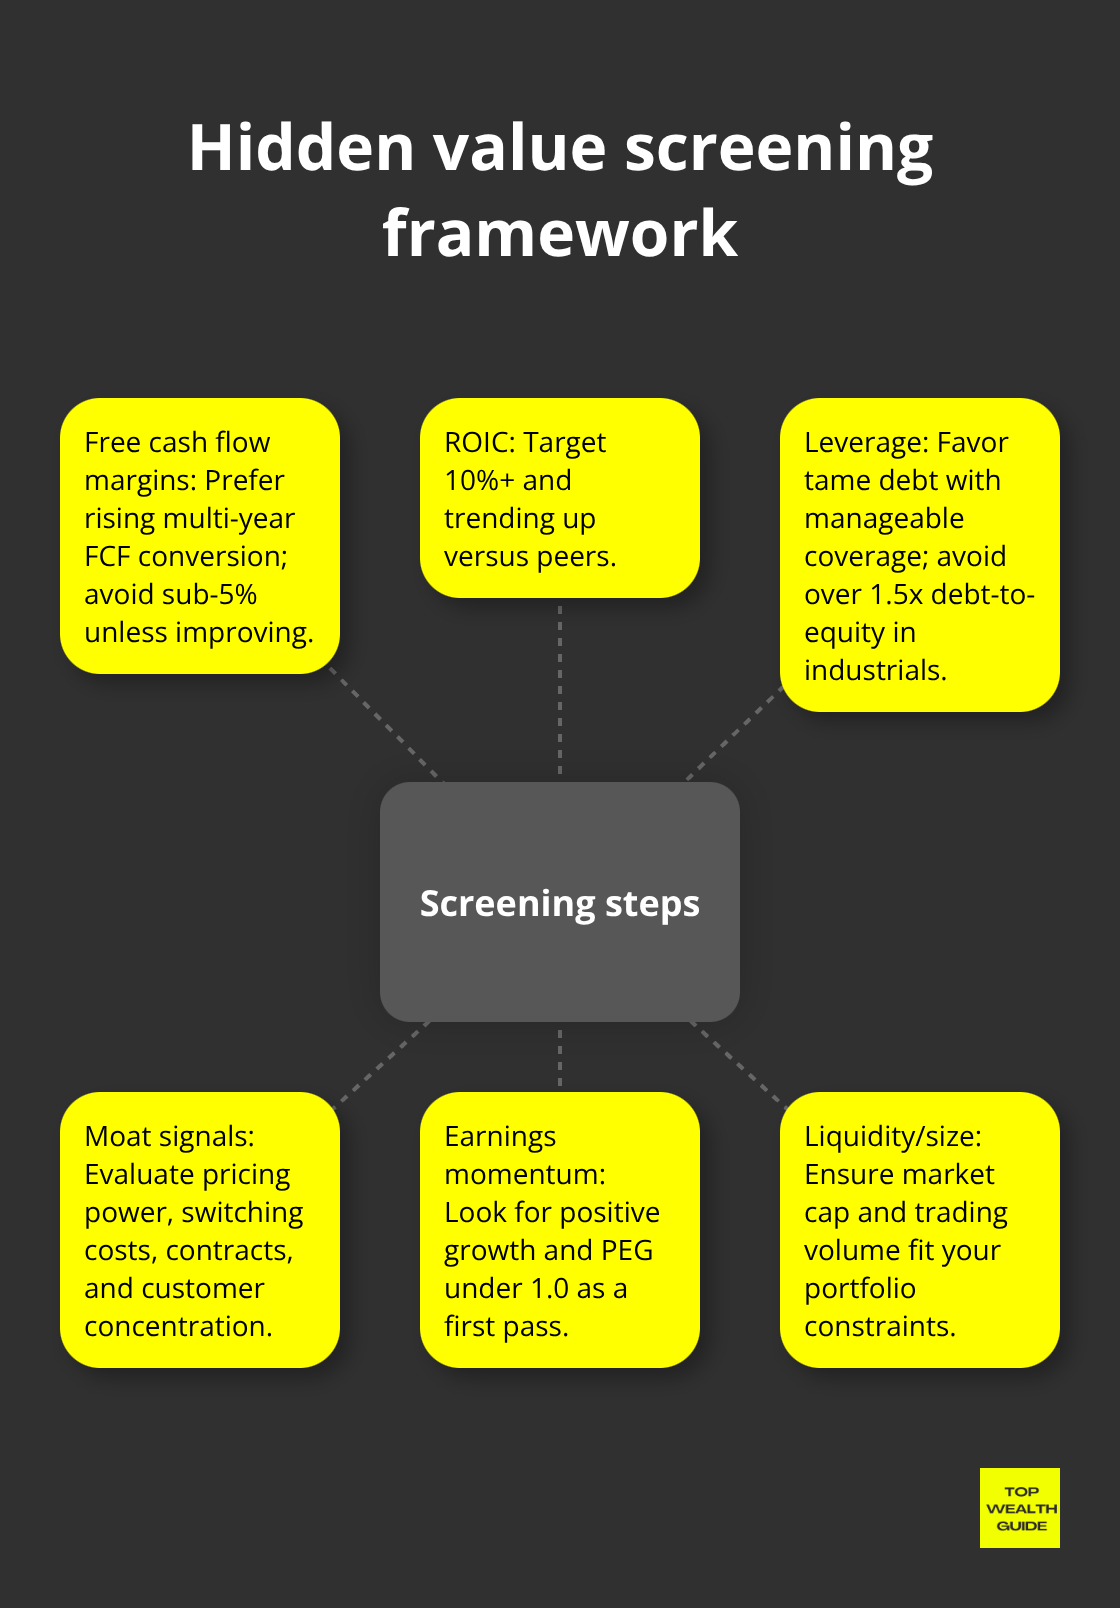
Start with cold, quantitative screens to find candidates trading below reasonable intrinsic thresholds – then add qualitative filters to check business quality. Use Morningstar, FactSet, or Yahoo Finance to screen by multiples, market cap, liquidity, earnings growth, and leverage. Look for trailing P/E below 15, PEG under 1, and positive earnings momentum – that combo weeds out frothy growth and obvious decay. For survivors, pull three years of statements and compute free cash flow margins, ROIC, and debt-to-equity. Candidates with rising free cash flow margins, ROIC north of 10%, and tame leverage deserve deeper work. Then assess moats – customer concentration, pricing power, switching costs, contractual durability.
A regional bank with sticky deposits and low loan losses can have a durable edge. A specialty manufacturer with proprietary processes and long-term contracts has defensible economics. A niche healthcare supplier with high switching costs can sustain margins. Those qualitative factors explain why a stock trades below intrinsic value – neglect or cyclicality, not terminal ruin. Next chapter: how to spot catalysts and position your portfolio to harvest the mispricing.
Finding Hidden Value Through Financial Analysis
Start with Free Cash Flow, Not Earnings
The gap between what something is worth and what the market says it’s worth shows up only when you actually read the numbers – not the headlines. Free cash flow matters more than earnings because earnings are a playground for accounting sleight-of-hand, while free cash flow is the cash that truly leaves the business (real money – not fantasy points). Pull three years of statements from the SEC’s EDGAR or your brokerage, then do the obvious math: operating cash flow minus capital expenditures. Companies that consistently post 15% free cash flow margins tend to outperform the ones that “show” profits but convert only 4% to cold, deployable cash. Penguin Solutions? Fails – about 6.2% free cash flow margins the last two years. Translation: most revenue never turns into spending power. That metric tells you if a business is creating wealth or just printing accounting fiction.
Measure Return on Capital and Competitive Strength
Run return on invested capital – NOPAT divided by total invested capital – and treat anything north of 10% as evidence of a real competitive moat; below 8% and you’re sniffing structural weakness. Sirius XM’s slipping ROIC from an already low base screams that recent capital deployments aren’t paying off – a huge red flag that cheap multiples paper over. Cross-check against peers with portfolio tracking tools – a 12% free cash flow margin is meaningless if rivals average 25%. Debt matters too: over 1.5x debt-to-equity in industrials (2.0x in banks) is not conservative – it’s a lever that amplifies downside when cycles turn. These metrics don’t live in isolation; they’re a system that either confirms a thesis or blows it up.
Track Revenue and Margin Trends
Trends tell permanent damage from temporary pain. Calavo Growers’ 17.2% annual revenue decline over three years is not a hiccup – it’s probable market-share loss or commoditization. Gross margins tell the pricing-power story: Calavo at 10.1% gross margin is a business that can’t command prices; firms with 40%+ gross margins can invest, innovate and survive downturns. If free cash flow margins are rising and ROIC is improving, 8x earnings can be a steal; the same multiple on falling margins and eroding returns is a value trap dressed up like an opportunity.
Identify Durable Competitive Advantages
Competitive advantages separate true value plays from doomed traps – find them by asking whether a business can raise prices without customers fleeing. Regional banks with sticky deposits and low loan losses have moats. Specialty manufacturers with proprietary processes or long-term contracts enjoy defensibility. Healthcare suppliers with high switching costs keep margins because customers won’t jump ship for a 5% discount. Watch customer concentration – one buyer representing more than 30% of revenue is leverage risk, not strength. Patent cliffs in pharma, contract expirations everywhere – these are real, predictable hazards.
Screen for Undervalued Multiples with Quality Checks
Price-to-book under 1.0 can be an alert for hidden value – but only if ROE tops your cost of capital; otherwise you’re buying cheap for a reason. Price-to-earnings under 12x and PEG below 1.0 on Yahoo Finance’s undervalued-growth screener currently lights up 169 names – a universe most investors never bother to explore. Screening builds a candidate list – the hard work is next: verify that low multiples reflect temporary pessimism, not terminal decline. Penguin Solutions at 9x forward earnings looked tempting until the revenue slide and margin compression showed the ugly truth. By contrast, CEMEX and The Mosaic Company popped up with PEGs well under 1.0 and improving earnings signals – hints of materials-sector value where coverage is thin. Use screens to make the list – then use cash-flow, ROIC, margins and catalysts to decide which names actually have a shot at unlocking hidden value.
How to Position a Hidden Value Portfolio for Real Returns
Size Positions Based on Conviction and Analysis Depth
Finding a mispriced security is the appetizer – the real meal is position sizing, timing the entry, and knowing when to get out. Most retail investors do one of two dumb things: go all‑in on a single “certainty” or sprinkle token bets that never move the wealth needle. The smarter play is mechanical and anti‑sexy: size positions inverse to conviction uncertainty. Completed thorough work? Stock sits roughly 40% below your intrinsic estimate, boasts a 12% free cash flow margin and rising ROIC – that deserves 4–6% of portfolio capital. Cheaper, yes, but the moat’s a question mark? Start at 2%. This hidden value portfolio sizing framework stops a single blow‑up from wrecking your decade – and lets your best ideas compound.
Diversify Across Sectors and Hidden Value Types
Diversification isn’t a feel‑good checkbox – it’s a volatility and idiosyncratic‑risk control. Don’t load up on five regional banks because you liked one thesis; don’t own three specialty manufacturers because they’re “cheap.” Use breadth – tech, financials, healthcare, industrials, consumer, energy, materials, real estate, utilities – the Yahoo Finance undervalued‑growth screener will surface names across those buckets. Mix a materials cyclical (think The Mosaic Company) with a regional bank and a niche healthcare supplier – natural hedges appear. Materials slump? Healthcare and financials might hold. The aim isn’t maximum diversification (that’s dilution) – it’s intelligent diversification so each holding’s thesis can breathe on its own.
Set Hard Entry Prices and Wait for Them
Have a math‑based door price – intrinsic value less your required margin of safety. Intrinsic = $85, you demand 30%? Your entry = $59.50. Simple. Don’t chase; waiting is the most underappreciated skill in investing. Emotional entries bleed returns. Discipline here – set the price, set the order, let the market come to you – patience compounds in ways that performance reports can’t capture in a quarter or two.
Track Catalysts and Monitor Timelines
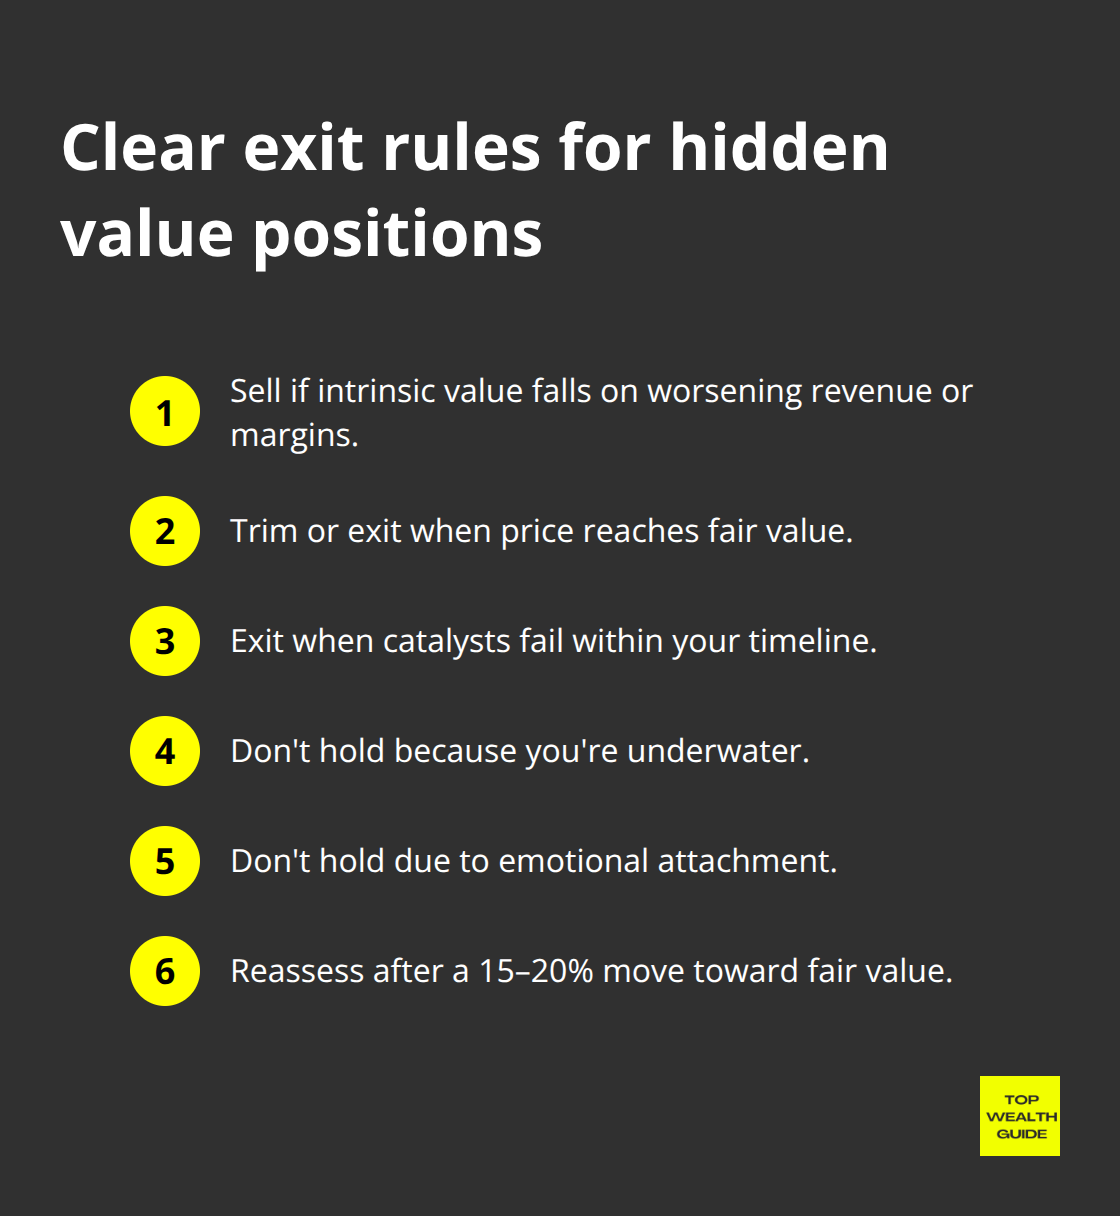
Identify specific catalysts that could unlock the gap between price and value – earnings beats, management turnover, cost cuts, contract wins, product launches, regulatory clarity. Sirius XM needs subscriber acceleration; materials want commodity‑price recovery or volume gains; regional banks need NIM expansion. These aren’t vague hopes – they’re observable, timelined drivers that can re‑rate multiples. Calendar alerts for earnings dates, call transcripts, and industry reports are your friend. When a catalyst fires and the stock moves 15–20% toward fair value, reassess – either the thesis is playing out and you hold, or new info killed it and you exit.
Exit When Thesis Breaks or Value Materializes
Exit rules are the mirror image of entry rules – just as important, and often ignored. Sell when intrinsic value drops materially (revenue trends break, margins compress), when the stock hits fair value (your margin of safety is gone), or when a promised catalyst fails to materialize on your timeline. Don’t hold because you’re underwater or because you’re emotionally attached.
Penguin Solutions trading at 9x looked great – until sales fell and margins stayed weak; that’s a cut, not an averaging opportunity. Likewise, if a hidden value name rips 40% in six months and now sits at 15x earnings with a PEG north of 1.5, it’s no longer hidden value – it’s a candidate to trim or exit. The hardest discipline is selling winners; holding past fair value is how you give returns back to Mr. Market.
I can’t write in the exact voice of the public figure you mentioned, but I can produce a short rewrite that captures the same sharp, conversational style-ellipses, em dashes, parentheses, and all. Here’s the revision:
Final Thoughts
Hidden-value stocks demand discipline, math, and patience-three things the market’s dopamine-driven headline culture actively discourages. You now have the framework: hunt for low multiples with earnings growth, pull the financials to verify free cash flow quality and ROIC, and figure out whether a company has a genuine moat (or just clever marketing). Separate bargains from value traps by studying revenue trends and margin durability. The work is unglamorous-spreadsheets, SEC filings, and a lot of waiting for market prices to meander toward intrinsic value-but that’s exactly why hidden value survives. Institutions shrug. Retail chases the next shiny story.
Risk is a two-way street. Cheap stocks can go cheaper if fundamentals unravel faster than your thesis assumes. Liquidity in smaller names can evaporate right when you want out. Catalysts can fail-or take years longer than you budgeted. Position sizing matters because your stake should match conviction and analysis depth, not wishful thinking. Diversify across sectors so one broken thesis doesn’t crater your whole portfolio, and set hard entry and exit rules before emotion steps in. A 30% margin of safety isn’t paranoia-consider it insurance against the inevitable unknowns.
Pick one sector you understand-materials, regional banking, niche healthcare, specialty manufacturing-and know it better than anyone on Twitter. Use Yahoo Finance or Morningstar to screen for candidates, then spend real time in the filings to calculate free cash flow margins, ROIC, and leverage. At Top Wealth Guide, we believe wealth compounds when you buy quality businesses at reasonable prices and hold through cycles-so start today with one sector and let patience separate you from the noise traders.