
Stock valuation methods are the financial tools investors use to get a handle on a company's intrinsic value. The whole point is to figure out if a stock's current price is fair, a bargain (undervalued), or way too high (overvalued), so you can make investment decisions based on logic instead of guesswork.
In This Guide
- 1 Why Stock Valuation Is Your Ultimate Investing Edge
- 2 The Three Core Philosophies of Valuing a Company
- 3 Unlocking Intrinsic Value with Discounted Cash Flow
- 4 Finding Value with Relative Valuation Multiples
- 5 Using Specialized Methods for Unique Companies
- 6 Putting It All Together with a Practical Checklist
- 7 Frequently Asked Questions (FAQ)
- 7.1 1. What is the single "best" method to value a stock?
- 7.2 2. How do you value a company that isn't profitable?
- 7.3 3. Where can I find the data needed for valuation?
- 7.4 4. How do I know if my assumptions (like growth rate) are reasonable?
- 7.5 5. Can stock valuation predict short-term price movements?
- 7.6 6. What's the difference between enterprise value and market cap?
- 7.7 7. Does a high P/E ratio automatically mean a stock is overvalued?
- 7.8 8. What does it mean if a stock trades below its book value?
- 7.9 9. How does inflation impact stock valuation?
- 7.10 10. Which valuation method is best for tech startups vs. industrial companies?
Why Stock Valuation Is Your Ultimate Investing Edge

Think of stock valuation as your financial compass. The market is constantly buzzing with hype, speculation, and noise, and this skill is what keeps your decisions grounded in reality, not emotion. You'd never buy a house without getting it professionally appraised to know what it's really worth, right? So why would you buy a piece of a company without doing the same?
That simple question is the cornerstone of intelligent investing.
The Power of Knowing What a Business Is Worth
When you get good at valuing stocks, you stop being just another person along for the market's ride. You become a sharp, informed investor who can spot real opportunities. Instead of chasing the latest hot stock tip or panicking over news headlines, you learn to systematically find value that everyone else is overlooking.
This analytical mindset gives you a serious edge. It helps you:
- Identify Undervalued Gems: You can find great companies whose stocks are trading for less than they're actually worth. This creates the potential for major returns when the market finally catches on.
- Avoid Overpriced Traps: It protects your hard-earned money by helping you steer clear of popular stocks whose prices have been bid up way beyond their fundamental value.
- Invest with Confidence: When your decisions are based on your own solid analysis, you have the conviction to stick with your investments, even when the market gets choppy.
By focusing on the underlying value of a business, you detach yourself from the market's daily mood swings. This shift in perspective is the foundation of building sustainable, generational wealth.
A Framework for Intelligent Investing
This guide isn't some dense, academic textbook. We're going to take valuation from a complex theory and turn it into a practical tool you can use to hit your financial goals. We'll walk through the same techniques Wall Street pros use, but break them down into simple, clear steps. You don't need a Ph.D. in finance to grasp the core ideas behind figuring out what a company is worth.
Learning these concepts is the first step on a much bigger journey. The best investors combine different valuation methods with solid qualitative research. To go deeper, check out our guide on investment research methods the pros don't want you to know. This is all about building a repeatable process that empowers you to make smarter, more profitable decisions for years to come.
The Three Core Philosophies of Valuing a Company
Before we get tangled up in the formulas and spreadsheets, it’s crucial to understand the big picture. Just about every method for valuing a stock falls into one of three main philosophical buckets. Getting these core approaches down first gives you a mental map for everything else we'll cover. It's the "why" behind the "how."
Think of it like putting a price on a vintage car. You could estimate all the rental income it might generate over its lifetime (that's its intrinsic value). Or, you could see what similar models are selling for on the market (that's relative value). You could even add up the value of its engine, tires, and frame if sold for parts (that's asset-based value). Each angle gives you a different, yet valuable, perspective.
1. Intrinsic Value
The intrinsic value philosophy boils down to a single, powerful question: "What is this business actually worth on its own, based on the cash it's going to generate in the future?"
This approach forces you to see a stock not as a flickering ticker symbol, but as a genuine piece of a business and a claim on its future profits. The heavyweight champion of this category is the Discounted Cash Flow (DCF) analysis. It’s the most academically respected and theoretically sound way to value a company, as you might learn more about on Wikipedia.
- Analogy: Think of it like a rental property. Calculating intrinsic value is like figuring out the total rent you'll collect over the property's entire life, but adjusting that total to reflect that a dollar today is worth more than a dollar ten years from now.
2. Relative Value
Relative valuation is what you’ll see and hear about most often on financial news or in analyst reports. It doesn't bother trying to calculate a company's absolute worth from the ground up. Instead, it asks a much simpler question: "What is this business worth compared to other, similar businesses?"
This is the world of valuation multiples, like the famous Price-to-Earnings (P/E) ratio. You simply look at a company’s P/E and stack it up against its direct competitors or the industry average. It's a quick and dirty way to see if something looks cheap or expensive right now.
Key Takeaway: Relative valuation is popular for a reason—it’s fast and gives you a great read on current market sentiment. But it has one giant flaw: if an entire industry is in a bubble, a stock might look "cheap" next to its peers but still be wildly overpriced in reality.
3. Asset-Based Value
Our third philosophy takes a more nuts-and-bolts, liquidation-style approach. It asks, "If we shut this company down today and sold off every single thing it owns, what would be left over?"
Here, you painstakingly add up the value of all the company's assets—its cash, inventory, factories, and equipment—and then subtract all of its liabilities, like debt. What remains is the company's book value, or net asset value. Many investors see this as a potential "floor" for the stock's price.
- Analogy: This is like valuing that vintage car by adding up the secondhand price of its engine, tires, chassis, and stereo system if you were to sell each piece individually.
Getting a firm handle on these three different ways of thinking about value is fundamental. The legendary investor Benjamin Graham, a true master of this craft, often used multiple approaches to find his famous "margin of safety." You can learn more about his timeless strategies in our article on Benjamin Graham's value investing principles.
Three Core Stock Valuation Philosophies Compared
| Valuation Philosophy | Core Question | Primary Methods | Best For |
|---|---|---|---|
| Intrinsic Value | What are the company's future cash flows worth today? | Discounted Cash Flow (DCF) | Stable, predictable businesses with visible long-term cash generation. |
| Relative Value | How is this company priced compared to its peers? | P/E Ratio, P/S Ratio, EV/EBITDA | Quick comparisons within the same industry to gauge market sentiment. |
| Asset-Based Value | What is the net worth of all the company's assets? | Book Value Calculation | Industrial firms, banks, or companies potentially facing liquidation. |
As you can see, there’s no single "best" method. The right approach depends entirely on the type of company you're analyzing and what question you're trying to answer. A seasoned investor keeps all three in their toolkit.
Unlocking Intrinsic Value with Discounted Cash Flow
Let's dive into what many seasoned investors consider the gold standard of valuation: the Discounted Cash Flow (DCF) analysis. The core idea behind DCF is both simple and incredibly powerful. A company's true, underlying worth is nothing more than the sum of all the cash it's expected to generate in the future, with one crucial adjustment.
That adjustment is for the time value of money. Think about it: a dollar in your hand today is worth more than a dollar you'll receive a year from now. Why? Because you can invest today's dollar and watch it grow. DCF applies this same fundamental logic to all of a company's projected future earnings.
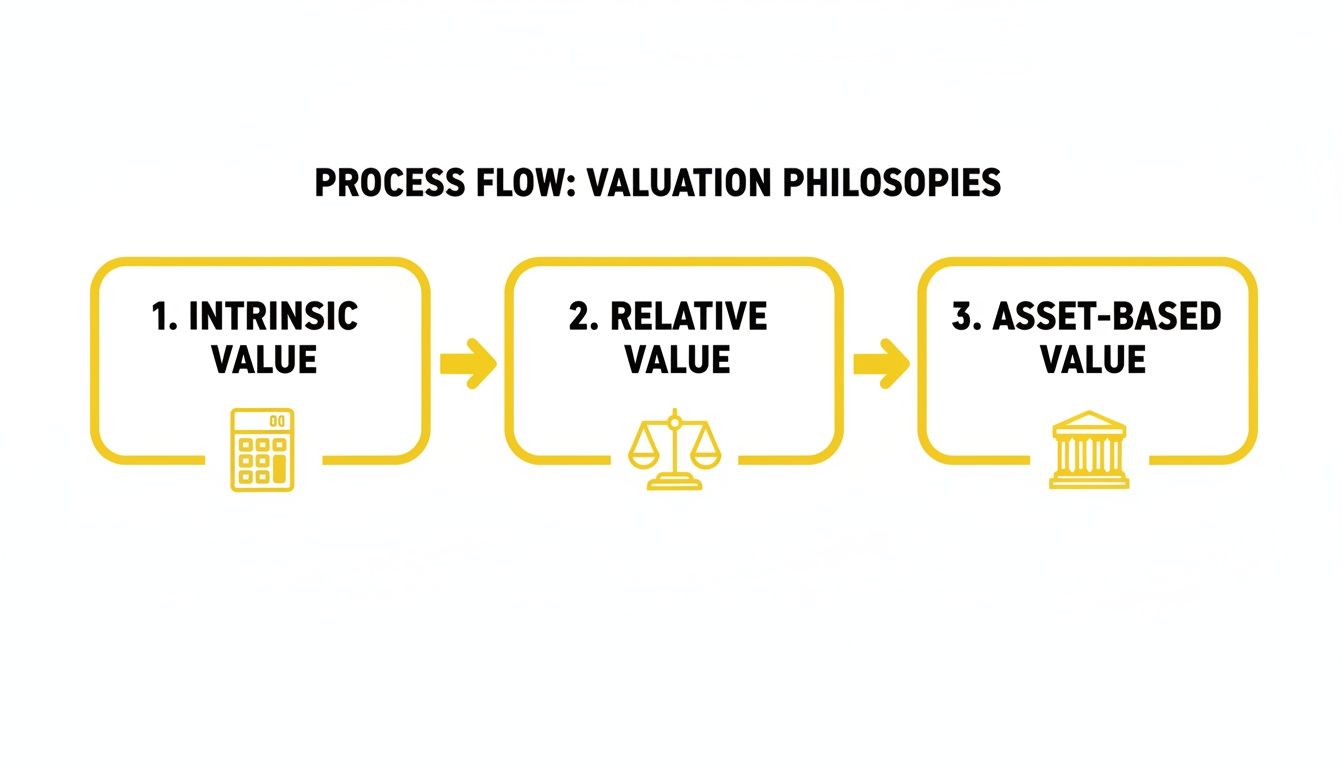
As the diagram shows, figuring out a company's intrinsic value is a distinct path from comparing it to its peers (Relative Value) or adding up its assets (Asset-Based Value).
The Three Key Ingredients of a DCF Model
A full-blown DCF model can look intimidating, but it really just comes down to three key ingredients. My goal here isn't to turn you into a spreadsheet wizard overnight, but to give you a solid feel for the logic driving this essential tool.
- Projecting Free Cash Flow (FCF): First, you need to estimate how much actual cash the business will produce. This isn't profit; it's the cash left over after paying all operating costs and reinvesting in the business. We typically try to forecast this out for 5 to 10 years.
- Choosing a Discount Rate: Next, we need a way to bring those future cash flows back to today's value. The discount rate is the annual return you'd demand to justify taking on the risk of that specific investment. A common proxy for this is the Weighted Average Cost of Capital (WACC).
- Estimating a Terminal Value: Since no one can predict cash flows forever, we have to estimate the company's value at the end of our forecast period (say, year 10). This "terminal value" represents the value of all cash flows from that point into the distant future.
Once you have these three pieces, the math is straightforward. You discount each year's projected FCF and the terminal value back to their present values, then add them all up. The final number is your estimate of the company's intrinsic value.
A DCF valuation is a powerful exercise because it forces you to think critically about the fundamental drivers of a business—its growth prospects, profitability, and risk profile—rather than just its current stock price.
Real-World Example: Valuing Microsoft (MSFT)
Let's make this tangible. Imagine an analyst is building a DCF model for a mature, cash-generating giant like Microsoft. They would start by digging into Microsoft’s past financial performance and management guidance to project its free cash flow (FCF) for the next 5-10 years.
- Step 1: Project FCF. They might forecast FCF growth based on the expansion of Azure (cloud services), Office 365 subscriptions, and gaming revenues. Let's say they project FCF to grow from $70 billion to $100 billion over five years.
- Step 2: Determine Discount Rate. They would then calculate Microsoft's Weighted Average Cost of Capital (WACC), which might be around 8-9%, reflecting its stability and low risk.
- Step 3: Calculate Terminal Value. After year five, they'd assume a modest, perpetual growth rate (e.g., 2-3%, in line with long-term economic growth) to calculate the terminal value.
- Step 4: Find Intrinsic Value. By discounting all these future cash flows back to the present using the 8-9% WACC, the analyst might arrive at an intrinsic value per share of, say, $450.
If Microsoft's stock is currently trading at $410, this DCF analysis suggests it is undervalued. Of course, this entire process hinges on good data and sound assumptions, which is why it's critical to be comfortable reading financial statements. If you feel a bit rusty, our guide on how to analyze financial statements is a great place to start.
Pros and Cons of DCF Valuation
No valuation tool is perfect, and DCF is no exception. It's crucial to know its strengths and weaknesses before you put too much faith in the number it spits out.
| Pros of DCF | Cons of DCF |
|---|---|
| Focuses on Fundamentals: It’s built on a company's ability to generate cash—the ultimate source of shareholder value. | Highly Sensitive to Assumptions: Tiny tweaks to the growth or discount rate can lead to wildly different valuations. |
| Not Swayed by Market Moods: It gives you a value based on business performance, not stock market hype or panic. | Difficult for Unpredictable Companies: It’s a poor fit for startups or highly cyclical businesses with erratic cash flows. |
| Encourages Long-Term Thinking: It forces you to consider a company’s long-term competitive durability and strategy. | Terminal Value Dominance: This single estimate often makes up a huge chunk of the total value, adding a layer of risk. |
At the end of the day, DCF is an indispensable tool in any serious investor's kit. It requires thoughtful work and realistic assumptions, but its unwavering focus on the core economics of a business provides a solid anchor for making smart investment decisions.
Finding Value with Relative Valuation Multiples
If you've ever shopped for a house, you probably didn't just look at one. You looked at comparable homes—"comps"—in the same neighborhood to get a feel for a fair price. Relative valuation in stock investing works the exact same way.
Instead of trying to calculate a company's precise, intrinsic worth from scratch, this approach compares it to its peers. It’s a powerful shortcut that uses financial ratios, or multiples, to put a company's stock price into context. It helps answer a critical question: how does the market feel about this stock compared to the competition?
The Famous Price-to-Earnings (P/E) Ratio
The most well-known multiple by far is the Price-to-Earnings (P/E) ratio. It’s a simple, elegant way to ask, "How much are investors willing to pay today for every dollar of a company's earnings?"
- Calculation: P/E Ratio = Current Share Price / Earnings Per Share (EPS)
A high P/E often suggests that investors are optimistic and expect strong future earnings growth. On the flip side, a low P/E might signal that a stock is overlooked and undervalued, or it could mean the company is facing some serious headwinds. But remember, a P/E ratio is completely useless in a vacuum. Its real power is in the comparison.
Real-World Example: Coca-Cola (KO) vs. PepsiCo (PEP)
Let's see how this works in practice by comparing two beverage giants.
| Metric (Hypothetical Data) | Coca-Cola (KO) | PepsiCo (PEP) | Industry Average |
|---|---|---|---|
| Share Price | $62 | $175 | – |
| Earnings Per Share (EPS) | $2.50 | $7.00 | – |
| P/E Ratio | 24.8x | 25.0x | 24.5x |
In this scenario, both Coca-Cola and PepsiCo are trading at roughly the same P/E multiple, and both are slightly above the industry average. This tells us that, based on current earnings, the market values these two rivals very similarly. Neither appears obviously cheap or expensive relative to the other or the broader sector. This kind of direct comparison is the heart of relative valuation.
The real art of using multiples isn't just plugging numbers into a formula. It's making sure you're comparing apples to apples. A fast-growing tech company will have a wildly different P/E from a stable utility company, and comparing them directly would be a huge mistake.
Beyond Earnings with EV/EBITDA
Sometimes, a company's reported earnings (the "E" in P/E) can be a bit fuzzy. Accounting decisions around things like depreciation can distort the true picture of a company's cash-generating ability.
That's where the Enterprise Value to EBITDA (EV/EBITDA) multiple comes in. It’s a more robust alternative that looks at a company’s total value (including its debt) relative to its raw operational earnings before any of those non-cash accounting expenses get deducted.
- Enterprise Value (EV): Market Cap + Total Debt – Cash
- EBITDA: Earnings Before Interest, Taxes, Depreciation, and Amortization
This multiple is a favorite among analysts for comparing companies that have different amounts of debt or different tax situations, as it strips those factors out of the equation.
A Comparison of Common Valuation Multiples
Every multiple tells a slightly different story. The trick is knowing which one to use for the right situation.
| Multiple | Formula | What It Measures | Best For |
|---|---|---|---|
| P/E Ratio | Share Price / EPS | How much the market will pay for $1 of current earnings. | Profitable, stable companies. |
| P/S Ratio | Share Price / Revenue Per Share | How much the market values every dollar of company sales. | Unprofitable growth companies or cyclical businesses. |
| EV/EBITDA | Enterprise Value / EBITDA | A company's total value relative to its raw earnings power. | Comparing companies with different debt levels or tax situations. |
The Long-Term Power of Relative Value Investing
History has shown that focusing on companies trading at lower prices relative to their fundamentals—what we call value stocks—has been a remarkably successful strategy over the long haul.
Looking at nearly a century of market data, value stocks have consistently outperformed their more glamorous growth stock counterparts. In fact, since 1928, value stocks in the U.S. have beaten growth stocks by an average of 4.54% each year. While some recent years have definitely favored high-flying growth names, the long-term evidence is pretty clear: a disciplined approach to value investing can deliver fantastic risk-adjusted returns. You can dig deeper into this history in the research from Initial Data Offering.
This enduring trend is exactly why getting a handle on relative valuation is a cornerstone of building a resilient investment portfolio. It's a proven method for spotting potential bargains that the rest of the market might be ignoring.
Using Specialized Methods for Unique Companies
You can't fix a car with just one wrench, and you can't value every company with the same formula. While methods like DCF and multiples are fantastic workhorses, they can stumble when faced with certain types of businesses. To really build out your analytical toolkit, you need to know which specialized valuation method to pull out for those unique situations.
This is all about moving past a one-size-fits-all mindset and learning to pick the right tool for the job.

Sometimes, a company's real worth is tied up in its dividends. Other times, it’s all about the physical stuff it owns. And for many modern companies, it’s the brilliant ideas that matter most.
Valuing Mature Cash Cows with the Dividend Discount Model
What about those steady, mature companies that reliably send checks to their shareholders? For them, the Dividend Discount Model (DDM) is often the perfect fit. Think of established utility companies or blue-chip consumer staples—the tortoises of the market.
Real-World Example: Valuing Johnson & Johnson (JNJ)
An investor focused on income might use the DDM to value Johnson & Johnson, a company famous for its consistent dividend payments for over 60 consecutive years. They would estimate JNJ's future dividend growth rate (based on historical trends and future prospects) and determine a required rate of return. The DDM would then calculate a present value for all future dividends, providing an estimate of the stock's intrinsic value based purely on its ability to return cash to shareholders.
- Best Use Case: Valuing companies in slow-growth, predictable industries with a long, consistent history of paying—and raising—their dividends.
- Limitation: It’s completely useless for companies that don't pay dividends, which includes most high-growth tech firms and startups.
Finding the Floor with Asset-Based Valuation
But what if a company isn’t profitable, or its future looks incredibly murky? This is where Asset-Based Valuation comes in. It provides a solid floor for a company’s value by asking a straightforward question: "If we sold everything and paid off all the debts, what would be left?"
The calculation is simple: add up all the assets (cash, inventory, property, equipment) and subtract all the liabilities. What's left over is the company's book value.
Real-World Example: Valuing a Major Bank
When analyzing a large bank like JPMorgan Chase (JPM), asset-based valuation is crucial. An analyst would look at its book value, or more specifically its Tangible Book Value (which excludes goodwill and other intangibles), as a key measure of its worth. If JPM's stock price were to fall significantly below its tangible book value per share, value investors might see it as a major buying opportunity, as they could theoretically buy the bank's high-quality assets for less than they are worth on paper.
- Industrial firms with lots of heavy machinery and real estate.
- Banks and insurance companies, since their assets are mostly financial.
- Estimating the liquidation value of a business that's struggling to survive.
This approach gives you a conservative, tangible baseline for a company's worth. If you find a stock trading below its book value, it could be a signal of a potential bargain—as long as the assets on the balance sheet are valued accurately.
The Challenge of Valuing Intangible Assets
Here’s the biggest puzzle for modern investors: how do you value a company built on ideas? For tech giants, pharmaceutical innovators, or brands with die-hard followings, a huge chunk of their value comes from intangible assets.
We're talking about things like patents, brand reputation, and proprietary software. These don't usually show up on a traditional balance sheet, but they are immensely valuable. A prime example is Tesla, whose brand and vision are arguably as important as its factories; you can explore more about Tesla's unique valuation challenges in our deep dive.
The market has understood the power of innovation for a long time. In fact, historical analysis shows that back in the 1920s, a 5% increase in a firm's patent count was linked to a 0.26% jump in its market value. As detailed in this research on innovation's impact on stock values, the returns on this kind of "intangible capital" were roughly three times larger than in the previous decade.
Putting a number on these assets often requires specialized techniques that go beyond standard models, like analyzing royalty streams or conducting complex brand equity studies.
Putting It All Together with a Practical Checklist
Knowing the theory behind stock valuation is great, but the real work—and the real value—comes from applying it in the real world. This is where we bridge the gap from theory to practice, turning all these concepts into a clear framework you can actually use. Think of this as your roadmap from raw data to a confident investment decision.
One of the most important lessons you can learn is that valuation isn't about finding a single, magical number. It just doesn't exist. Your real goal is to establish a reasonable valuation range. By layering several different methods on top of one another, you get a much more robust picture of what a company might be worth, protecting you from the inevitable blind spots of relying on just one model.
The Importance of Sensitivity Analysis
Before we dive into the checklist, let's talk about a crucial step: sensitivity analysis. This is simply the process of asking "what if?" What happens to my valuation if I tweak my key assumptions? What if the long-term growth rate is 2% instead of the 3% I initially plugged in? How much does the final number change if I nudge the discount rate up a bit?
Running these different scenarios isn't a sign of weakness or uncertainty. It's the hallmark of a smart, thorough analyst. It shows you exactly how much your valuation hinges on specific predictions and helps you map out the full spectrum of possibilities, from the best-case to the worst-case scenario.
Your Step-by-Step Valuation Checklist
Use this checklist to bring some structure to your process. Following these steps will help make sure you don't miss anything critical along the way.
-
Gather Your Materials: First things first, you need the raw ingredients. Download the company's latest annual (10-K) and quarterly (10-Q) reports. These documents are your ground truth for financial statements, management commentary, and known risks.
-
Understand the Business: Now, step away from the spreadsheet for a minute. What does this company actually do? Who are they up against? What gives them an edge—or what could knock them down? A number without a story behind it is just a number.
-
Select Your Methods: Don't put all your eggs in one basket. Pick at least two or three different valuation methods to build your case. A classic combo is to use one intrinsic model (like DCF) and a couple of relative ones (like P/E and EV/EBITDA). This gives you a balanced perspective.
-
Run the Numbers: This is the heavy lifting. Build your models, do the math, and be meticulous. Double-check every input and write down your key assumptions for things like growth rates, discount rates, and which companies you're using as comps. A tiny mistake here can lead to a huge error in your final conclusion. If you want a more detailed breakdown, our due diligence checklist before any major investment can help.
-
Perform Sensitivity Analysis: Time to stress-test your work. Create a simple table showing how your intrinsic value changes under different scenarios. This is how you'll define your credible valuation range.
-
Synthesize and Interpret: Look at the results from all your models. Do they point in the same general direction? If your DCF model spits out a value of $50 and the P/E multiple analysis suggests $52, you're getting a pretty consistent signal. But if one model says $50 and another says $120, you've got some digging to do to figure out why they're so far apart.
-
Make a Decision: Finally, compare your valuation range to the stock's current price. Is there enough of a "margin of safety" to make it a compelling investment? Your conclusion shouldn't be a gut feeling; it should be a clear, logical argument built on all the evidence you just gathered.
Frequently Asked Questions (FAQ)
Jumping into stock valuation can feel like learning a new language, and it's natural to have a lot of questions. Here are answers to some of the most common ones.
1. What is the single "best" method to value a stock?
There is no single "best" method. The most robust approach is to use a combination of methods. A Discounted Cash Flow (DCF) analysis is often considered the most theoretically sound for determining intrinsic value, while relative valuation using multiples like the P/E ratio provides crucial market context. Using both helps you create a more reliable valuation range.
2. How do you value a company that isn't profitable?
For unprofitable companies, traditional metrics like the P/E ratio are useless. Instead, analysts turn to other methods:
- Price-to-Sales (P/S) Ratio: This compares the stock price to its revenue, which is a better indicator of potential for growth companies.
- Enterprise Value-to-Sales (EV/Sales): A more robust version that accounts for debt.
- DCF Analysis: This becomes more speculative, as it requires forecasting when the company will become profitable and what those future cash flows will look like.
3. Where can I find the data needed for valuation?
Fortunately, most of the data is publicly available for free. The best sources are:
- Company SEC Filings (10-K and 10-Q): Found on the company's Investor Relations website or the SEC's EDGAR database.
- Financial Data Websites: Yahoo Finance, Google Finance, and Morningstar offer quick access to financials, multiples, and historical data.
4. How do I know if my assumptions (like growth rate) are reasonable?
This is more art than science, but it should be grounded in research. Start with the company's historical performance, listen to management guidance from earnings calls, and analyze the growth trends of the entire industry. Most importantly, perform a sensitivity analysis by testing a range of assumptions (optimistic, pessimistic, and base case) to see how they impact your final valuation.
5. Can stock valuation predict short-term price movements?
No. Stock valuation is a tool for estimating a company's long-term intrinsic worth, not for predicting next week's price fluctuations. Short-term prices are driven by market sentiment, news, and macroeconomic factors. Valuation helps you identify potential discrepancies between a stock's current price and its fundamental value, which is a strategy for patient, long-term investors.
6. What's the difference between enterprise value and market cap?
Market Cap is the value of a company's equity (Share Price x Shares Outstanding). It's the cost to buy all the company's stock. Enterprise Value (EV) is the cost to buy the entire business, including its debt. The formula is Market Cap + Total Debt – Cash. EV is often considered a more complete valuation metric.
7. Does a high P/E ratio automatically mean a stock is overvalued?
Not necessarily. A high P/E ratio often indicates that investors have high expectations for future earnings growth. It's crucial to compare a company's P/E to its direct competitors and its own historical average. A high P/E is a red flag only if the expected growth doesn't materialize.
8. What does it mean if a stock trades below its book value?
When a stock's Price-to-Book (P/B) ratio is below 1, it means the market values the company at less than the net value of the assets on its balance sheet. This could be a sign of a deep value opportunity, or it could mean the market believes the company's assets are impaired or that it cannot generate adequate returns from those assets.
9. How does inflation impact stock valuation?
Inflation significantly affects valuation. In a DCF model, higher inflation typically leads to a higher discount rate, as investors demand greater returns to offset the eroding value of their money. A higher discount rate reduces the present value of future cash flows, thus lowering the calculated intrinsic value of the company.
10. Which valuation method is best for tech startups vs. industrial companies?
The best method depends on the company's characteristics:
- Tech Startups: Often unprofitable with high growth, making the P/S Ratio or EV/Sales more useful than P/E. DCF is also used but is highly sensitive to long-term growth assumptions.
- Industrial Companies: These firms often have significant tangible assets, making Asset-Based Valuation (like Price-to-Book) a useful baseline. EV/EBITDA is also popular as it normalizes for heavy depreciation expenses.
This article is for educational purposes only and is not financial or investment advice. Consult a professional before making financial decisions.