
Buy and hold works for some investors, but momentum investing delivers faster returns by riding price trends. We at Top Wealth Guide show you how to identify winning stocks and exit before reversals happen.
This approach requires discipline and the right tools, but the data shows it can outperform passive strategies over shorter timeframes. Learn the tactics that separate successful momentum traders from those who chase losses.
In This Guide
What Momentum Investing Really Means
Momentum investing targets securities with strong recent price trends, betting those trends continue in the near term. Unlike buy and hold, which assumes long-term value compounds over decades, momentum exploits short-term price acceleration. The core principle is simple: stocks moving up tend to keep moving up for weeks or months before reversing. Richard Driehaus popularized this approach with a philosophy of buying high and selling higher, focusing on accelerating earnings growth, rising volume, and rising prices. Since 2020, momentum investing has delivered significantly stronger returns than traditional buy and hold in liquidity-driven markets, according to research from Brett Arends and Cliff Asness. The edge strengthens when you apply it to a diversified portfolio of individual stocks with monthly screening rather than simply holding a momentum ETF. This matters most: momentum requires active rotation, not passive holding. A momentum trader enters when price breaks above resistance with volume confirmation and exits when technical indicators show overextension or when fundamental catalysts fade. The strategy works because herd behavior and investor emotions fuel self-reinforcing trends, creating measurable opportunities before the crowd realizes the move.
The Speed Advantage Over Buy and Hold
Buy and hold investors wait years for positions to mature. Momentum traders capture returns in weeks or months. Research on financial crises shows that a simple momentum system using the Relative Strength Index and moving average crossovers outperformed buy and hold during the 1973 oil crisis, the 2000 dot-com crash, and the 2008 subprime crisis. The reason is mechanical: when markets decline, momentum signals tell you to raise cash or short positions, while buy and hold forces you to sit through drawdowns. Mebane Faber found that many of the market’s best and worst days occur when the market is already declining due to bear-market volatility. Momentum traders avoid this trap through rules, not emotions. Entry timing matters enormously. The strongest momentum bets happen when a shock or news catalyst triggers rapid price moves, with early positions often delivering the strongest rewards before the crowd joins. Exit discipline separates winners from losers. Most momentum traders fail because they hold too long, watching profits evaporate when the trend reverses.
Why Momentum Beats Buy and Hold in Shorter Timeframes
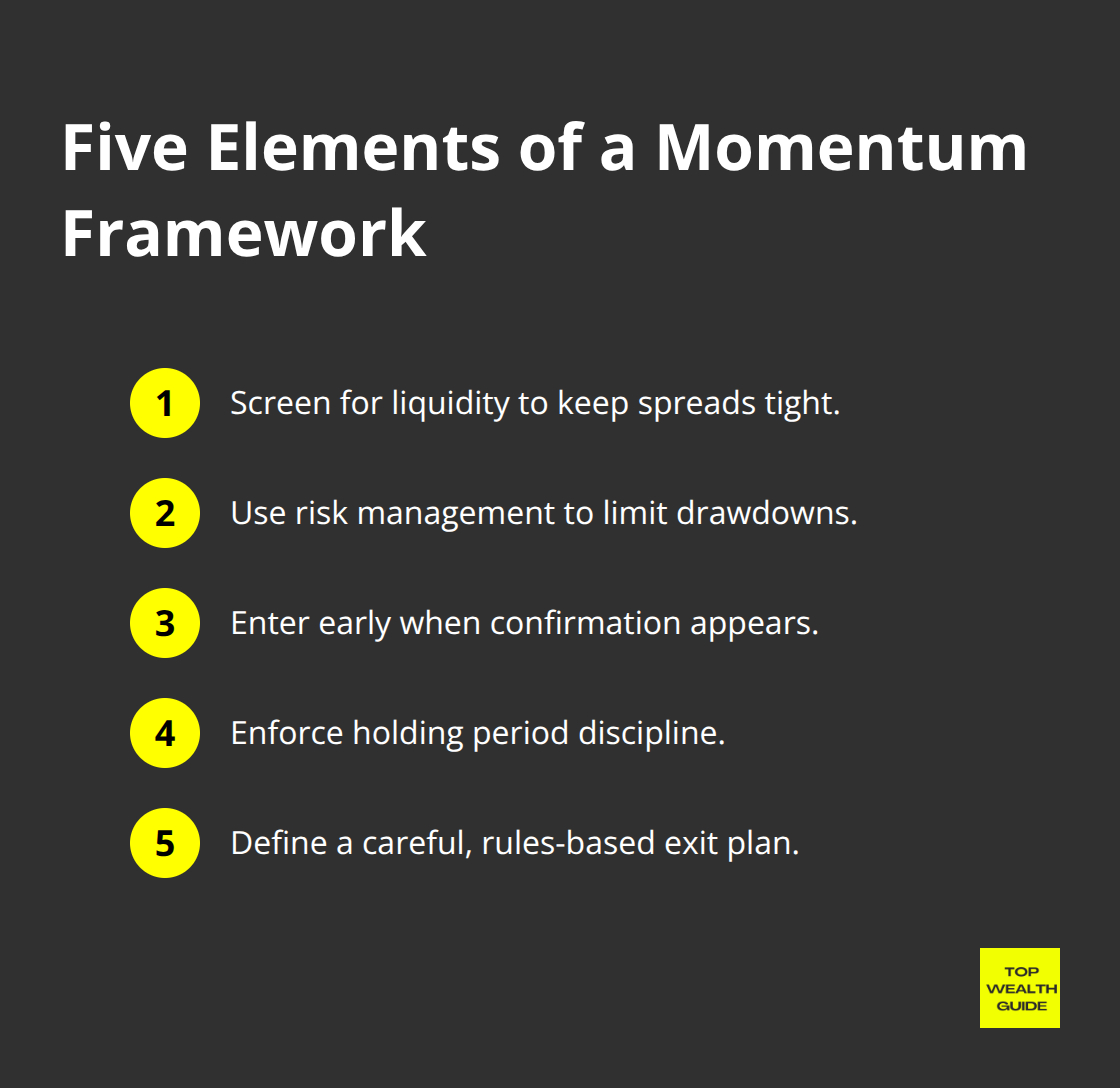
Momentum outperforms when markets trend strongly upward, which has been the case since 2020 due to trillions in monetary and fiscal stimulus. Choose liquid securities with at least 5 million shares traded per day to avoid wide bid-ask spreads that erode profits. Avoid leveraged or inverse ETFs because their price swings misrepresent underlying momentum. Position sizing matters more than most traders realize. Expect bigger price moves to profit, and adjust position size and stops when holding across multiple sessions. A practical framework centers on five elements: liquidity, risk management, entering early, holding period discipline, and a careful exit plan. Stop-loss orders protect gains and limit drawdowns in fast-moving markets.
Without them, a single reversal can wipe out months of gains. Momentum tends to excel in strongly trending bull markets, but timing regime shifts is essential to preserve risk-adjusted returns. The strategy works best when you concentrate on a small number of high-conviction bets rather than broad diversification, as demonstrated by legendary traders like Jim Slater and Cathie Wood of ARK Invest.
Building Your Entry and Exit Framework
Successful momentum traders establish clear rules before they enter any position. You need to identify which technical indicators align with your timeframe-whether you trade daily, weekly, or monthly. The Relative Strength Index, moving average crossovers, and volume confirmation all provide signals that reduce guesswork. Entry happens when multiple indicators align (price above the 50-day moving average, RSI above 50, and volume spike), not when just one signal appears.
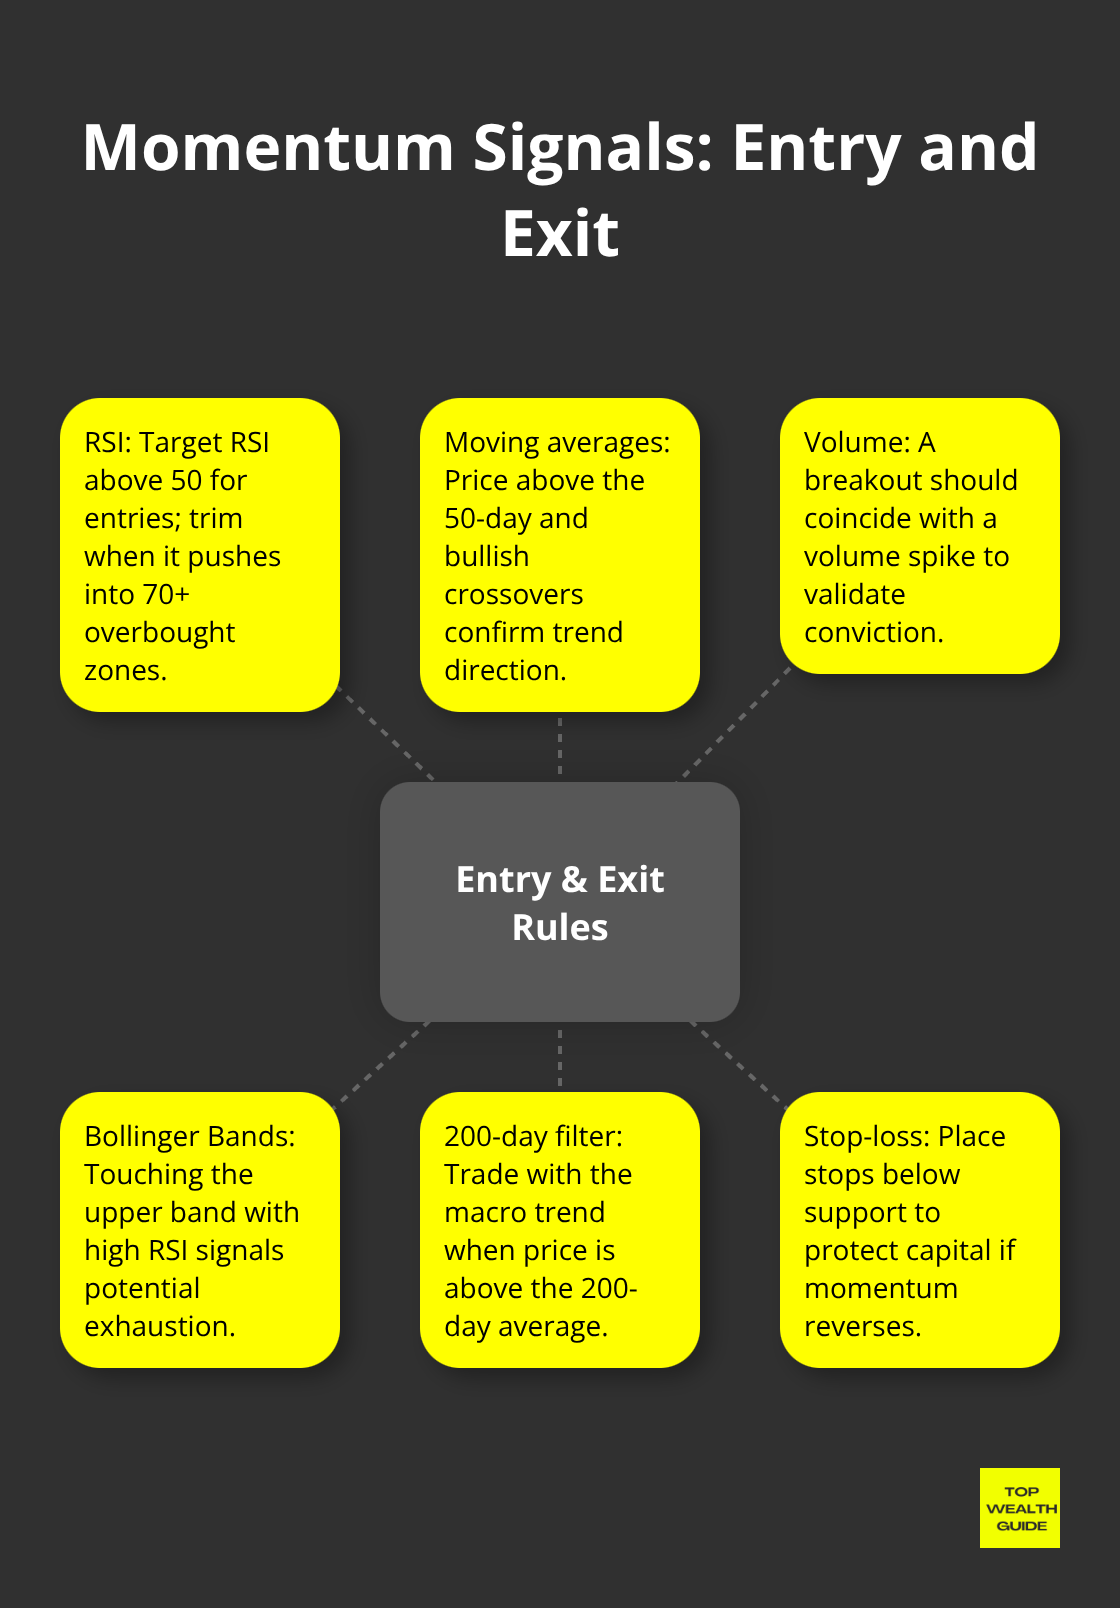
Exit rules matter even more than entry rules. You should exit when the trend shows signs of exhaustion-price touches an upper Bollinger Band, RSI reaches overbought territory above 70, or volume drops sharply on an up day. Legendary traders like Paul Tudor Jones used the 200-day moving average as a core momentum signal, combining it with macro trend analysis and strict risk controls. This two-layer approach (technical confirmation plus macro context) reduces false signals and protects capital when market regimes shift.
Risk Management Separates Winners From Losers
Position sizing determines whether momentum trading builds wealth or destroys it. A common mistake is risking too much on a single trade. Most successful momentum traders risk only 1-2% of account on any single position, allowing them to survive multiple losses without catastrophic damage. Stop-loss orders must sit below recent support levels, not at arbitrary percentages. If a stock breaks below support on high volume, that signals momentum has reversed-your stop should trigger before the move accelerates further. Diversification across different stocks and sectors prevents you from concentrating all capital in one momentum theme. When one sector’s momentum fades, other positions can still deliver gains. Legendary trader Stanley Druckenmiller employed a top-down macro momentum framework across currencies, equities, and commodities, corroborating momentum with technicals and maintaining strong risk controls. This cross-asset approach reduced drawdowns during regime shifts and captured opportunities others missed.
How to Spot Momentum Stocks Before They Peak
Identifying stocks with genuine upward momentum requires more than watching price charts. Start with liquidity screening: look for securities trading at least 5 million shares per day. This eliminates wide bid-ask spreads that destroy profits on entry and exit. Most retail traders skip this step and wonder why their position sizes fail to deliver expected results. Narrow spreads mean your capital moves efficiently into and out of positions.
Next, apply a two-indicator confirmation rule. Price must close above its 50-day moving average while the [Relative Strength Index](https://www.investopedia.com/terms/r/rsi.asp] sits between 50 and 70, showing strength without overbought exhaustion. This combination filters out false breakouts that trap early traders. Volume matters as the third filter: the stock should show a volume spike on the day it breaks above recent resistance. Without volume confirmation, the move lacks conviction and typically reverses within days.
Nicolas Darvas built wealth through momentum in the 1950s and emphasized this exact discipline. He waited for breakouts with volume confirmation before entering any position, then held with strict stops. His Darvas Box method combined price breakouts with volume spikes, reducing false signals significantly. Cathie Wood at ARK Invest screens for momentum around disruptive innovation themes, which adds fundamental conviction to technical signals. This matters because momentum lasting weeks or months usually aligns with real earnings acceleration or market theme shifts, not just crowd behavior.
A practical screening approach involves running a monthly scan for stocks above their 50-day moving average, with RSI above 50, and volume above the 90-day average. This mechanical process removes emotion and identifies candidates before they become obvious to the broader market.
Entry Timing Separates Quick Gains from Whipsaws
Entry precision determines whether you capture 15% gains in three weeks or suffer 8% losses in three days. Most traders enter too early or too late because they lack a specific trigger. Your entry rule should fire when three conditions align simultaneously: the stock closes above a previous swing high on above-average volume, the 50-day moving average slopes upward, and RSI crosses above 60 from below. This convergence signals genuine momentum shift, not a one-day spike.
Paul Tudor Jones used the 200-day moving average as his macro filter, entering momentum trades only when price sat well above this long-term trend line. This prevented him from fighting the broader market direction. Early entry within a new momentum cycle delivers the strongest rewards. Research shows that positions entered within the first two weeks of a breakout capture 60-70% of the total move, while late entries in week four or five risk catching the reversal.
Set your stop-loss immediately below the breakout candle’s low or the most recent swing low, whichever is lower. This placement lets normal volatility breathe while protecting capital if momentum genuinely reverses. Position size should risk only 1-2% of your total account on any single trade, allowing you to survive five consecutive losses without portfolio damage. Managing emotions through systematic strategies helps traders stick to position sizing rules when fear tempts them to overtrade.
Exit Discipline Prevents Profits from Evaporating
Exit rules matter more than entry rules because momentum reversals happen fast. When RSI reaches 75 or higher on the daily chart, the stock has entered overbought territory where reversals become likely within days. Exit at least half your position at this level, locking in gains while momentum still favors you. Watch for volume divergence: if price rises on declining volume, that signals weakening conviction among buyers. This pattern often precedes a pullback within one week. Exit the remaining position immediately when volume fails.
Bollinger Bands provide a mechanical exit signal. When price touches the upper band while RSI sits above 70, that marks textbook overextension. Legendary momentum traders like Jim Slater concentrated holdings and exited ruthlessly when technical signs faded, avoiding the trap of watching 20% gains shrink to 5% losses. Hold period discipline matters equally. Most momentum trades should close within 4-12 weeks because trends lose steam beyond that window. If your position hits the 12-week mark while still profitable, take profits regardless of how strong the setup appears.
The best momentum traders exit before the crowd realizes momentum has shifted, capturing gains that others sacrifice chasing the final 5%. This disciplined approach to exits sets the stage for the next critical skill: managing risk through stop-loss orders and position sizing to protect your capital across multiple trades.
Where Momentum Traders Lose Money
The gap between knowing momentum principles and executing them separates profitable traders from those who destroy capital. Most retail investors fail because they enter late when a stock has already moved 30-40%, chasing performance at the exact moment momentum peaks. This timing mistake costs more money than any other single error. A stock that rises 15% in two weeks looks obvious in hindsight, but by week three when retail traders finally notice and buy, institutional buyers are already exiting. The stock reverses 8-12% within days, trapping late entrants. Money psychology and emotional decisions drive irrational trading in crises, making these choices catastrophic during volatile reversals. The 2008 subprime crisis demonstrated this perfectly: traders who held through the reversal lost 50%+ while those with mechanical exit rules preserved 70-80% of gains.
Establish Rules Before You See the Setup
You must establish entry rules before you see the setup, not after. A practical filter prevents chasing peaks: only enter stocks within the first two weeks of a breakout above the 50-day moving average. If a stock has already risen more than 25% from its breakout point, skip it entirely. This discipline eliminates the temptation to chase strength when your odds of catching reversals spike dramatically. Late entries trap traders in the worst possible positions-they buy when institutional money exits and hold when reversals accelerate.
Recognize When Momentum Has Peaked
Ignoring reversal signals costs traders tens of thousands annually because they confuse momentum with long-term trends. Volume divergence, RSI above 70, and price touching upper Bollinger Bands all scream that momentum has peaked, yet traders hold hoping for one more 5% gain. That extra 5% never comes. Instead, the position reverses 12-15% while the trader watches in denial. Exit half your position the moment RSI reaches 70, then exit completely when volume fails on an up day. These mechanical signals protect capital far better than emotional hopes for continued strength.
Concentrate Your Capital on High-Conviction Setups
Overtrading destroys accounts faster than any single bad trade because transaction costs and taxes erode returns across dozens of small positions. A trader screening 50 stocks monthly and entering 8-10 positions simultaneously spreads capital too thin, preventing proper position sizing and increasing exposure to simultaneous reversals. Concentrate on three to five high-conviction setups per month instead. This approach lets you risk 2% per position without fragmenting your account. The difference is dramatic: five quality trades with proper sizing outperform fifteen mediocre trades with fractured positions.
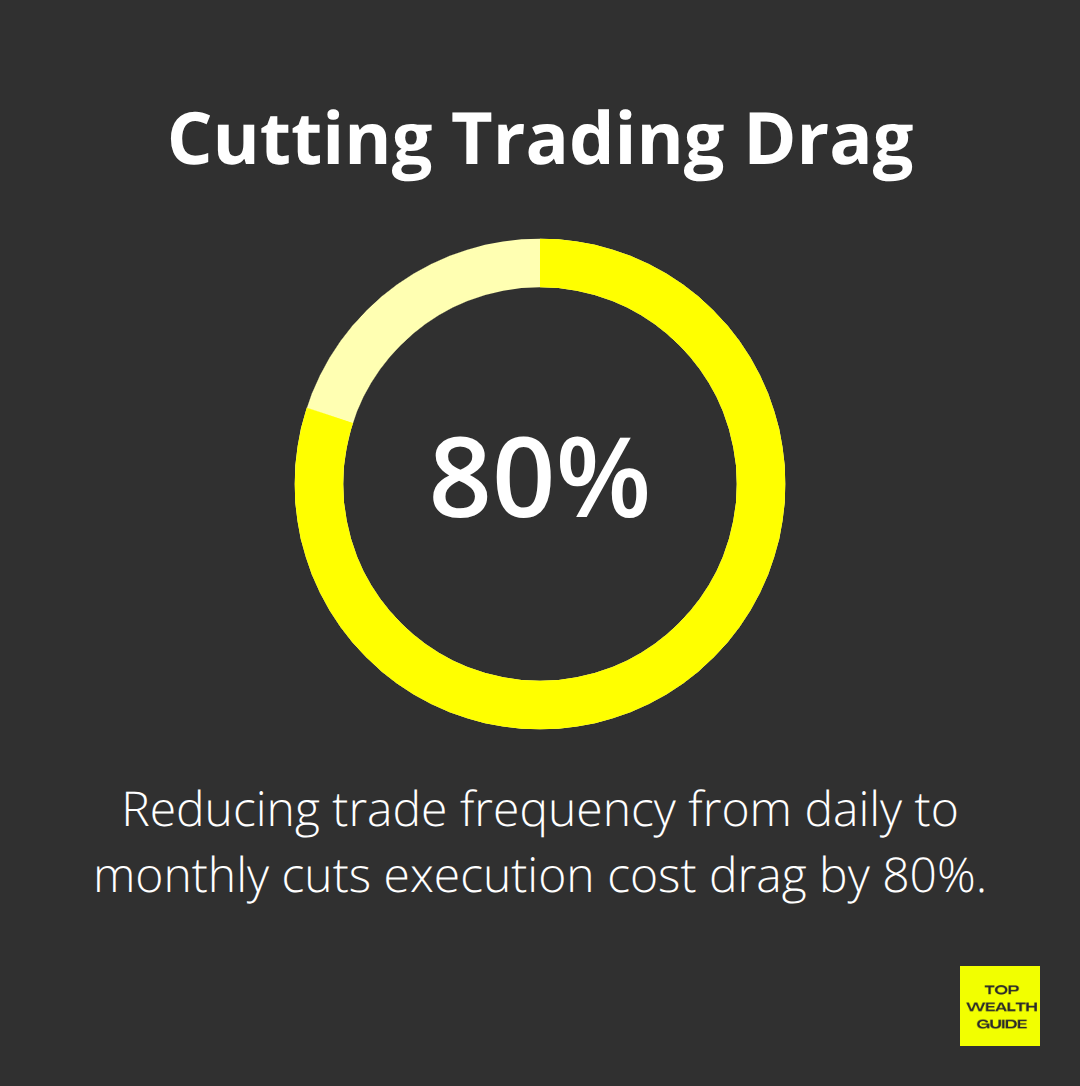
Legendary trader Jim Slater concentrated in only a handful of holdings and exited ruthlessly when signals faded, avoiding the trap of managing dozens of positions simultaneously. Monthly screening rather than daily trading also reduces the cost of commissions and spreads. Each trade costs 0.1-0.3% in execution costs, so reducing trade frequency from daily to monthly cuts this drag by 80%. That difference compounds into 3-5% annual performance advantage over time.
Final Thoughts
Momentum investing works best during strong bull markets when trends persist for weeks or months. Since 2020, momentum strategies have outperformed buy and hold significantly due to sustained upward price trends fueled by monetary stimulus. However, momentum fails in choppy, sideways markets where price swings lack direction, and the 2015–2016 period plus early 2020 downturn showed that momentum can underperform when regime shifts occur.
A practical framework blends both strategies by allocating 60–70% of your portfolio to momentum tactics during confirmed uptrends and holding core positions in quality stocks for the remaining 30–40%. When technical indicators show momentum weakening, you reduce exposure and shift capital toward longer-term holdings, capturing momentum gains while protecting against regime reversals that destroy pure momentum portfolios. Stanley Druckelmiller employed this exact approach, rotating between aggressive momentum bets and defensive positions based on market conditions.
Track three metrics to measure your momentum investing performance: your win rate (successful momentum traders maintain 55–65%), your average gain versus average loss (winning trades should deliver 3–5 times the loss on losing trades), and your holding period (if your average trade lasts longer than 12 weeks, you hold momentum positions too long and catch reversals). Visit Top Wealth Guide for additional resources on building wealth through tactical strategies and long-term planning, and execute your rules consistently rather than trying to predict markets perfectly.