
Most stock pickers focus on company news and market trends, but they miss a critical tool: financial ratios. These numbers reveal what’s actually happening inside a company’s finances.
At Top Wealth Guide, we’ve seen investors make better decisions when they understand profitability, valuation, and safety ratios. This guide walks you through the three ratio categories that separate smart stock picks from costly mistakes.
In This Guide
Profitability Ratios Expose What Companies Actually Earn
Profitability ratios cut through management spin and accounting tricks to show what a company genuinely earns. These metrics reveal the true financial health beneath surface-level revenue numbers.
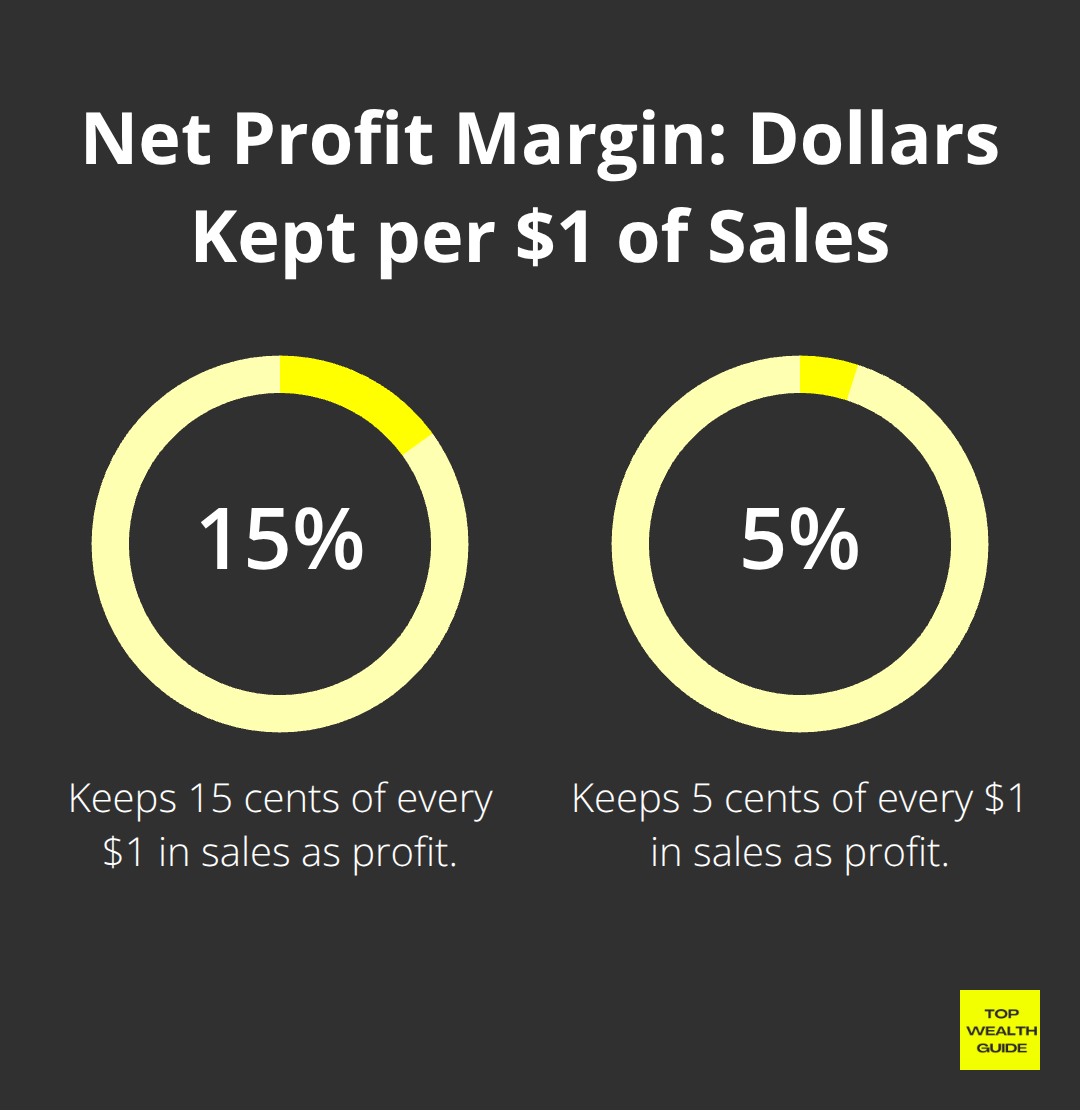
Net Profit Margin Reveals True Earnings Power
Net profit margin shows the percentage of revenue that becomes actual profit after all expenses. A company generating 15% net profit margin keeps 15 cents from every dollar of sales, while one with 5% margin keeps only 5 cents. Two companies with identical revenue can have vastly different profitability, and this ratio exposes that gap.
Comparing net profit margin to industry norms and historical averages identifies whether a company is improving or deteriorating. If a retailer’s margin drops from 8% to 6% year-over-year, that signals rising costs or intensifying competition, not growth. Companies with margins climbing steadily over multiple years demonstrate pricing power or operational efficiency that competitors struggle to match.
Return on Equity Measures Management’s Capital Deployment
Return on equity measures how much profit a company generates from shareholder capital. If a company has 100 million dollars in shareholder equity and produces 16 million dollars in net income, its ROE is 16%. This 16% return matters because it shows management’s ability to turn shareholder money into profits.
A good ROE increases steadily over time rather than spiking once. Look for return on equity that is equal to or just above the average for the company’s sector. However, extremely high ROE often attracts competitors who eventually erode those returns. The DuPont analysis breaks ROE into three components-net profit margin, asset turnover, and financial leverage-revealing whether high ROE comes from operational excellence or excessive debt. Compare ROE to industry benchmarks because a 12% ROE in banking looks weak while 12% in retail looks strong.
Return on Assets Reveals Productivity Across All Resources
Return on assets calculates how much profit a company extracts from its total assets. With 500 million dollars in assets and 50 million dollars in net income, ROA is 10%. This ratio reveals whether management uses equipment, inventory, buildings, and cash efficiently.
Capital-intensive industries like manufacturing or utilities typically show lower ROA because they require massive asset bases. Technology or service companies often display higher ROA since they generate profits with fewer physical assets. An ROA that improves year-over-year signals the company is extracting more value from existing resources. When ROA declines while revenue grows, it suggests the company is buying or building assets that haven’t yet generated returns, which warrants investigation into management’s expansion strategy. Comparing ROA across competitors in the same industry exposes which management teams operate most efficiently.
These three profitability metrics work together to paint a complete picture of earnings quality. The next step involves checking whether the market prices that profitability fairly-or whether you’ve found an opportunity the market has overlooked.
How to Spot Overpriced Stocks Using Three Essential Valuation Ratios
Profitability ratios tell you what a company earns, but they don’t answer the most important question: what should you pay for those earnings? A company posting 20% ROE means nothing if the stock price has already tripled in anticipation of that performance. Valuation ratios compare stock price to financial fundamentals, exposing whether the market has priced in reality or fantasy. Most stock pickers ignore this step and overpay for mediocre companies.
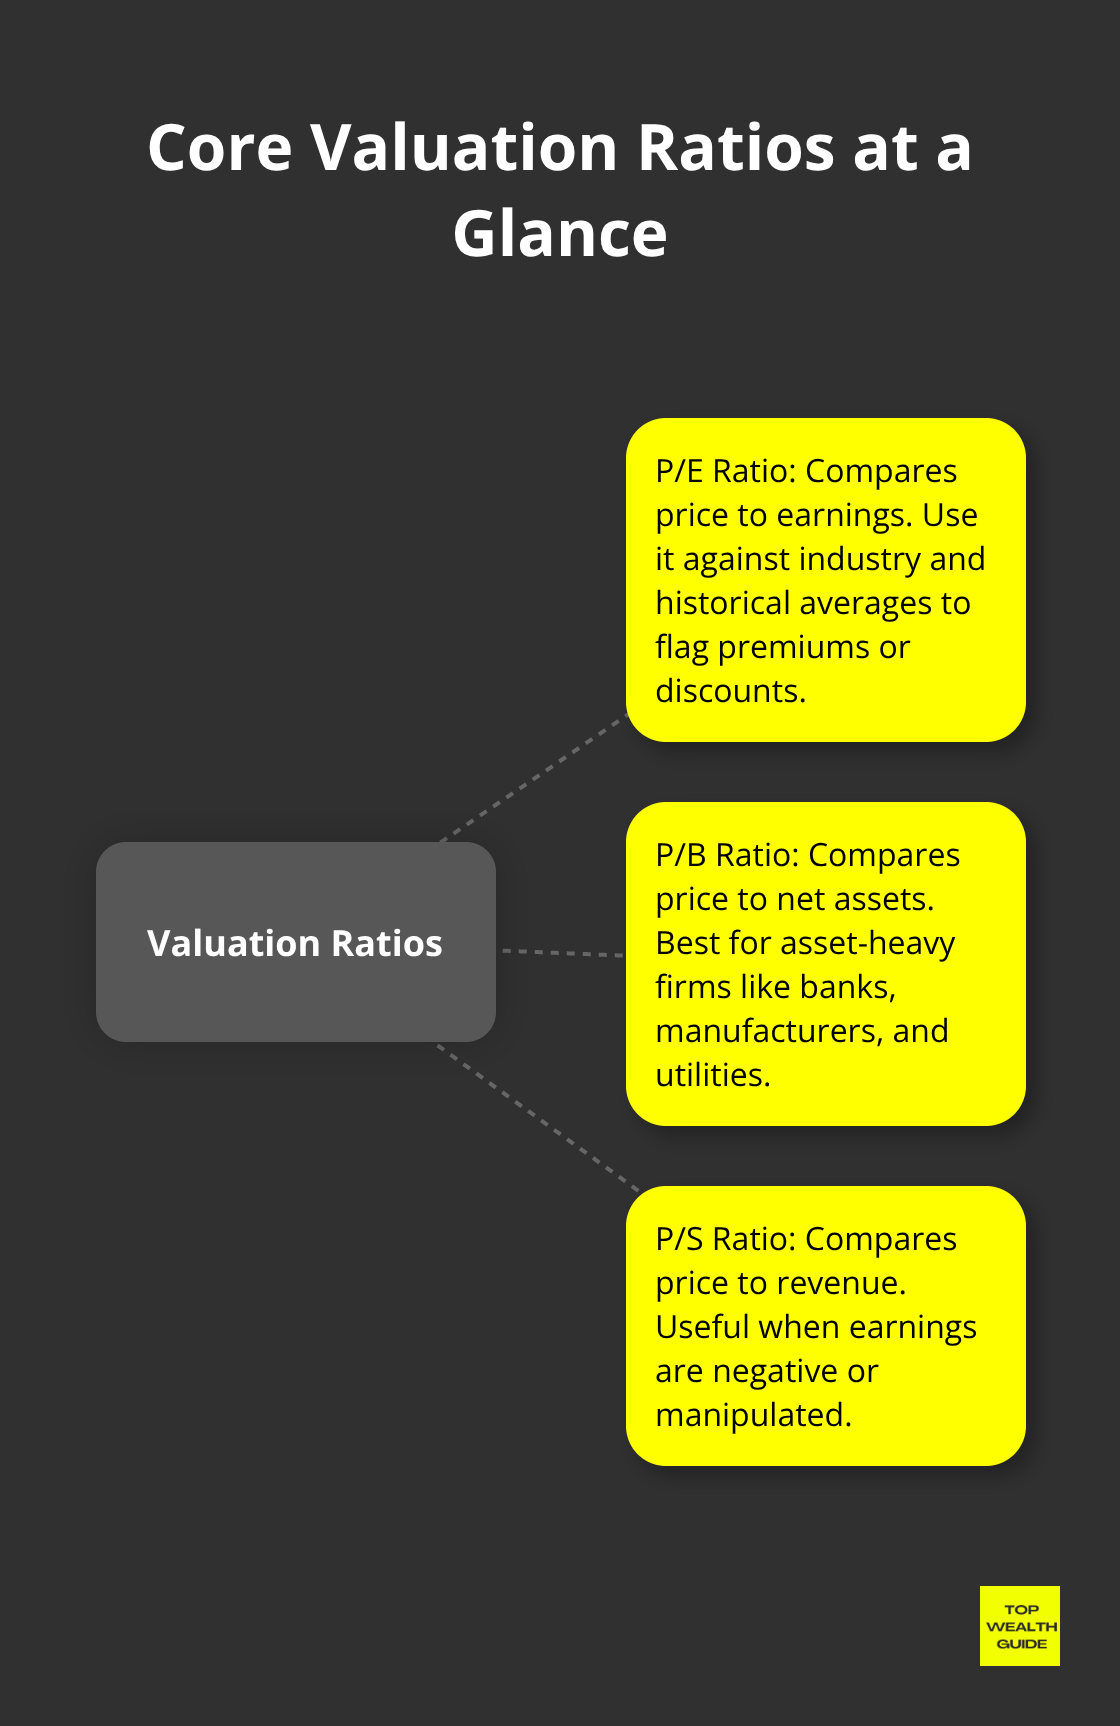
The Price-to-Earnings Ratio Filters Expensive from Affordable
The price-to-earnings ratio remains the fastest way to filter expensive stocks from affordable ones. If a stock trades at a P/E of 45 while its industry average sits at 18, that premium demands justification through superior growth or durable competitive advantages. Compare the stock’s P/E to its historical average over the past five years and to direct competitors in the same sector. A company trading at 15x earnings when peers average 20x might represent genuine value, or it might signal hidden problems that the market has already discounted.
Forward P/E, based on projected earnings rather than trailing twelve-month results, matters more for fast-growing companies, but those projections carry risk because earnings estimates frequently miss targets. The earnings yield, calculated as earnings per share divided by stock price, inverts the P/E ratio and helps you compare stock returns to alternative investments like bonds. If a stock offers a 6% earnings yield while ten-year Treasury bonds yield 4%, that 2% premium compensates you for the additional risk of equity ownership.
The Price-to-Book Ratio Works Best for Asset-Heavy Businesses
The price-to-book ratio compares stock price to the company’s net assets, calculated as total assets minus total liabilities. This ratio works best for capital-intensive businesses like banks, manufacturers, and utilities where physical assets represent genuine value. A P/B below 1.0 suggests the stock trades below its reported asset value, potentially signaling undervaluation, though it could also indicate that assets are deteriorating or generating poor returns.
Book value becomes unreliable for technology and service companies because intangible assets like software, brands, and customer relationships don’t appear on balance sheets at their true economic value. Warren Buffett famously bought Coca-Cola in the 1980s when it traded at a reasonable P/E despite strong brand value not reflected in book value, proving that P/B alone misses critical value drivers.
The Price-to-Sales Ratio Handles Earnings Manipulation
The price-to-sales ratio sidesteps earnings manipulation entirely by dividing stock price by annual revenue per share. Companies with negative earnings or those in turnaround phases have no meaningful P/E, making P/S the only valuation metric available. A lower P/S generally indicates better value, but this ratio ignores profitability and leverage, so a company with 1.0 P/S could be highly profitable or bleeding cash.
Try P/S as a screening tool to identify candidates worth deeper investigation, not as a final investment decision. Comparing all three ratios together reveals whether the market has mispriced a stock. A company with modest P/E, low P/B, and reasonable P/S deserves serious analysis, while a stock with elevated readings across all three metrics requires exceptional growth prospects to justify the premium. Once you’ve identified stocks that pass the valuation test, the next step involves confirming that the company can actually survive financial stress and meet its obligations.
Liquidity and Solvency Ratios Protect Against Risk
Profitability and valuation ratios tell you whether a company earns money and whether the market has priced it fairly. But they ignore a critical question: can the company actually pay its bills when business turns rough? A profitable company drowning in debt collapses faster than an unprofitable one with minimal obligations. Liquidity and solvency ratios separate companies that survive downturns from those that don’t, and ignoring them has bankrupted countless stock portfolios.
Current Ratio Measures Short-Term Payment Ability
The current ratio measures whether a company has enough liquid assets to cover short-term debts due within the next twelve months. Divide current assets by current liabilities, and a ratio in line with the industry average or slightly higher is generally considered acceptable. A retailer with 8 million dollars in current assets and 4 million dollars in current liabilities has a current ratio of 2.0, signaling healthy short-term liquidity.
However, excessively high current ratios above 4.0 sometimes indicate that management hoards cash rather than deploying it productively, which actually suggests weakness. Compare the current ratio to historical trends for the same company and to competitors because a ratio that has declined year-over-year from 2.5 to 1.8 warns of deteriorating financial health even if 1.8 still appears acceptable.
Quick Ratio Identifies Companies That Handle Emergencies
The quick ratio, also called the acid-test ratio, measures the dollar amount of liquid assets available against the dollar amount of current liabilities of a company. Calculate it as (current assets minus inventory and prepaid expenses) divided by current liabilities. This ratio reveals what happens if the company cannot sell inventory quickly during a crisis.
A quick ratio around 1.0 indicates the company can pay immediate bills without selling stock, while anything below 0.8 signals potential liquidity stress. A manufacturer with 10 million in current assets, 2 million in inventory, and 8 million in current liabilities has a quick ratio of 1.0, which passes the test, but the same company with 5 million in current liabilities would show a quick ratio of 1.0 that looks safe until you realize inventory comprises 20% of current assets.
Debt-to-Equity Ratio Shows Financial Leverage and Stability
The debt-to-equity ratio reveals how much leverage a company carries relative to shareholder capital. Divide total liabilities by total shareholders equity, and watch for ratios above 1.5 as a warning sign in most industries. A company with 3 million dollars in total debt and 13 million in equity has a D/E ratio of 0.23, indicating conservative leverage and lower financial risk.
However, the same 0.23 ratio in a capital-intensive utility company might signal underutilization of cheap debt financing that could fund growth. Industry context matters tremendously because a D/E ratio of 2.0 looks dangerous for a cyclical manufacturing company but reasonable for a stable utility with predictable cash flows.
Interest Coverage Confirms Debt Service Capacity
Combine the debt-to-equity ratio with the interest coverage ratio, calculated as EBIT divided by interest expense, to confirm that the company generates sufficient operating profits to service its debt. An interest coverage ratio above 5.0 indicates the company earns five times what it needs to pay interest, providing a comfortable margin of safety.
A ratio below 2.5 means the company barely covers interest payments and faces serious risk if earnings decline. When earnings are strong but interest coverage weakens year-over-year, management may have taken on additional debt without corresponding earnings growth, a red flag that demands investigation. These three ratios work together because high profitability means nothing if short-term liquidity collapses or debt becomes unmanageable. A company posting 20% ROE with a current ratio of 0.8 and D/E of 2.5 faces existential risk during industry downturns, while a modestly profitable company with current ratio of 2.2, quick ratio of 1.1, and D/E of 0.4 survives and potentially thrives when competitors fail.
Final Thoughts
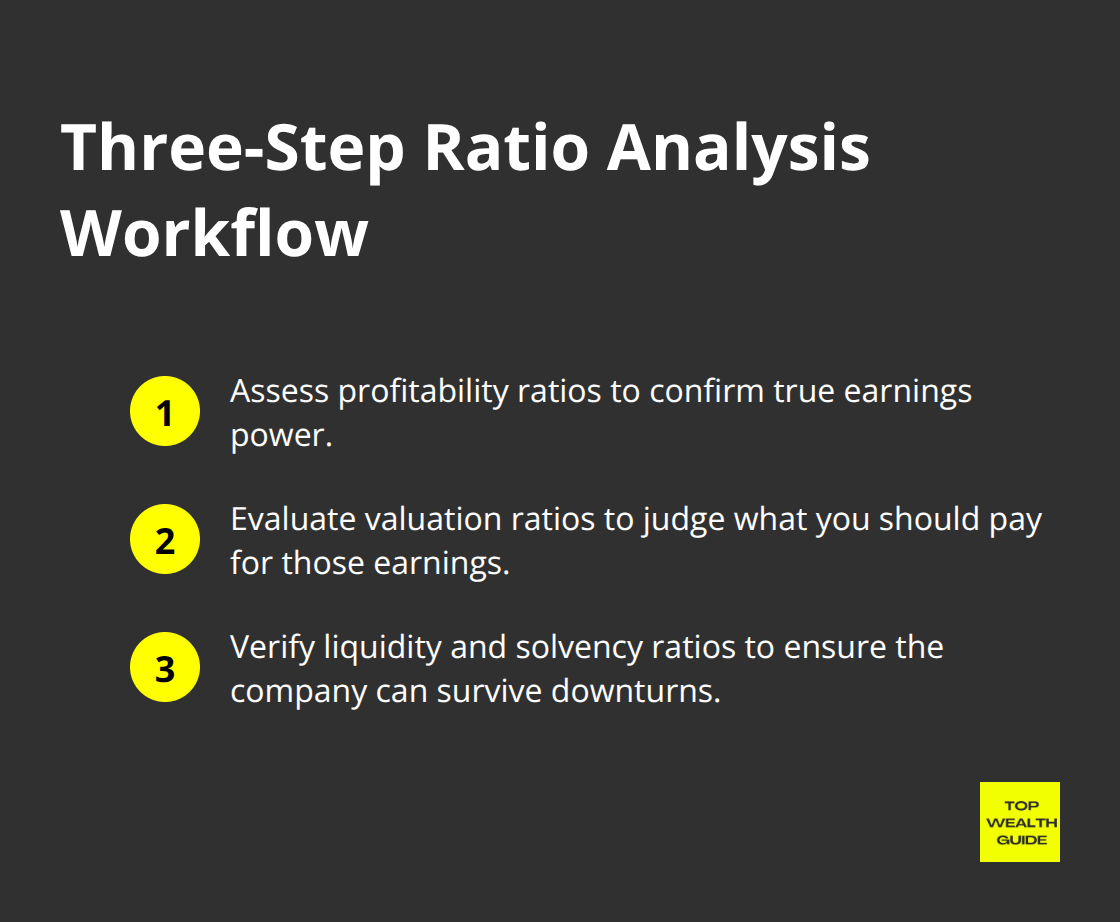
Financial ratios work best when you apply them in sequence rather than in isolation. Start by examining profitability metrics to confirm the company actually generates earnings, then check valuation ratios to determine whether the market has already priced in that profitability, and finally examine liquidity and solvency ratios to confirm the company survives downturns. This three-step approach using financial ratios catches problems that single metrics miss and prevents costly mistakes like overpaying for mediocre performance or buying companies that collapse during industry cycles.
A profitable company trading at a reasonable price collapses if it cannot pay its bills when business deteriorates, which is why you must evaluate all three ratio categories together. A company with exceptional profitability but sky-high valuation and dangerous leverage represents a value trap, not an opportunity, while a modestly profitable company trading cheaply with conservative debt levels and strong liquidity often outperforms the market over time. These financial ratios reveal what happened in the past and what the balance sheet shows today, but they cannot predict whether a company’s competitive position will strengthen or weaken.
Pair ratio analysis with research on competitive advantages, management quality, industry trends, and business model durability to build a complete investment thesis. We at Top Wealth Guide combine ratio analysis with qualitative research to identify stocks that offer genuine value rather than statistical anomalies. Start with the ratios covered in this guide, but always dig deeper before committing capital.