
Most investors chase individual stocks and miss the bigger picture. Sector rotation-shifting your money between different industries based on economic cycles-is where real returns hide.
At Top Wealth Guide, we’ve seen portfolios that rotate through sectors outperform buy-and-hold strategies by significant margins. This guide shows you exactly how to identify when sectors are about to move and position your portfolio accordingly.
In This Guide
How Sector Rotation Actually Works in Real Markets
Sector rotation operates on a simple principle: you move capital between industries as economic conditions shift, capturing outperformance that static portfolios miss. The National Bureau of Economic Research has tracked over 30 U.S. business cycles since 1854, each lasting roughly 5-6 years, and the data reveals a consistent pattern.
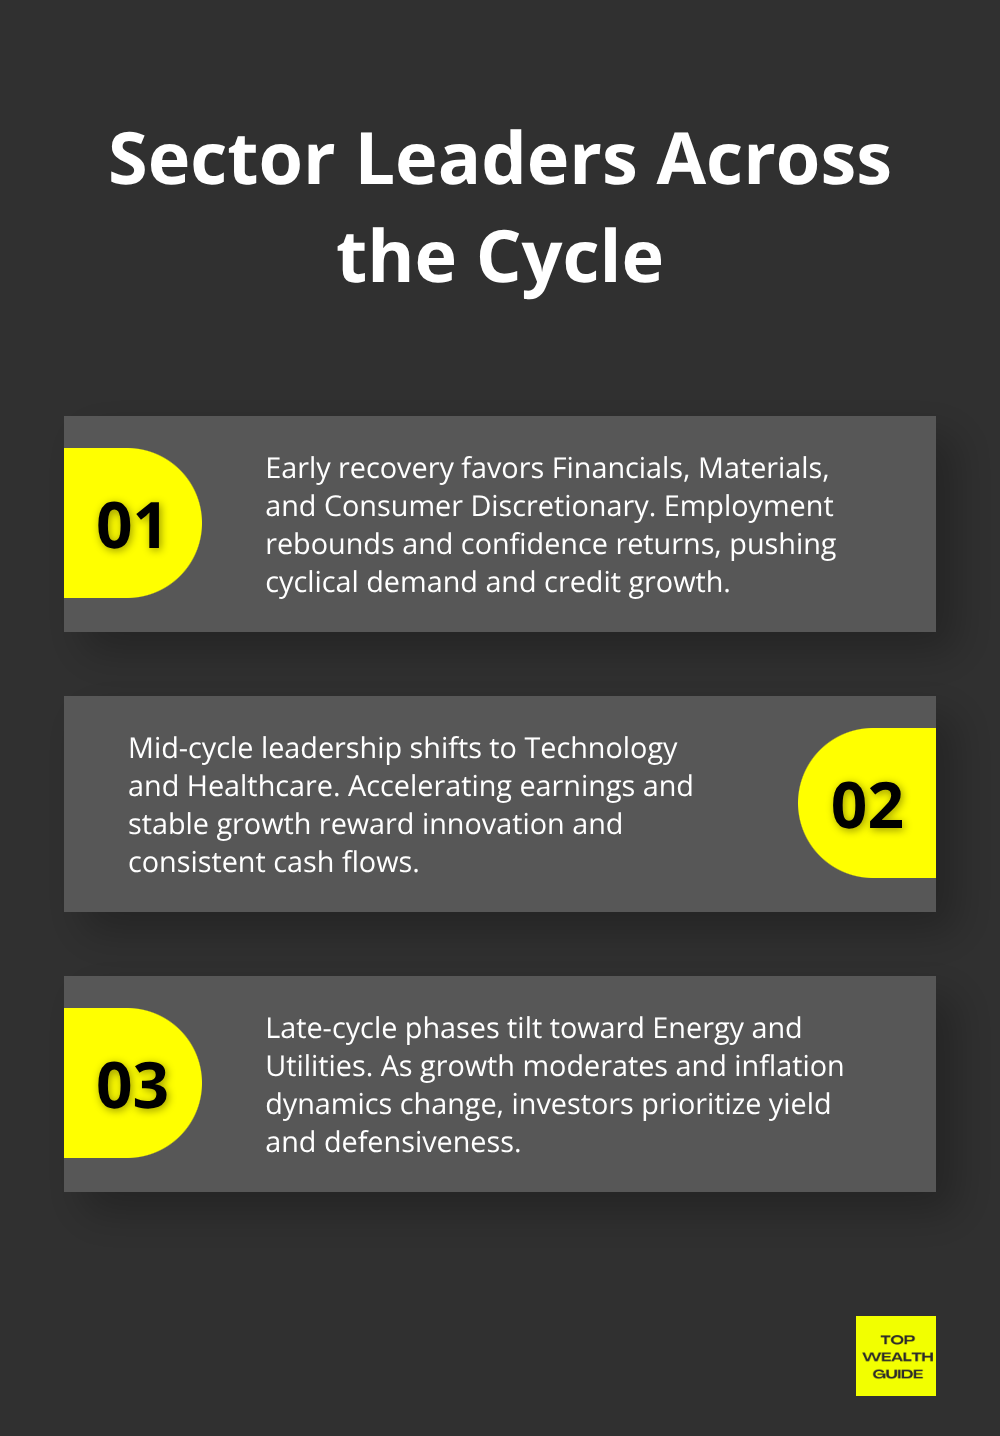
Financials, Materials, and Consumer Discretionary lead during early recovery as employment rebounds and confidence returns. Technology and Healthcare take over during mid-cycle as earnings growth accelerates. Late-cycle phases favor Energy and Utilities as growth moderates. This isn’t random. Each sector responds differently to inflation, interest rates, and consumer spending patterns, and disciplined sector rotation between them has delivered about 2.8% annual outperformance versus buy-and-hold over the past 30 years. That compounds significantly over decades.
The Three Drivers That Make Rotation Work
Economic sensitivity separates sectors into clear tiers. Cyclical sectors like Industrials, Materials, and Consumer Discretionary swing hard with GDP growth and unemployment, while non-cyclical stocks are steady earners in good times and bad. Defensive sectors like Consumer Staples, Healthcare, and Utilities barely budge during downturns. Technology sits in the middle, sensitive to interest rates but driven by innovation cycles. Understanding where your holdings sit in this hierarchy matters more than picking individual stocks.
Profit cycles amplify these moves further. Financials peak when interest rates rise and credit demand accelerates, while Utilities thrive when rates fall and investors hunt yield. The current market environment illustrates this perfectly. Since 2023, economically sensitive sectors including Communications Services, Technology, and Consumer Discretionary have led markets, buoyed by AI excitement and strong earnings. Leadership rarely lasts, however. Historical data from Bank of America shows bull markets last roughly 1,011 days on average with gains around 114%, while bear markets compress into 286 days with declines averaging 35%. Sector leadership rotates within both cycles, not after them. Investors who wait for a confirmed recession typically enter too late.
Recognizing When Sectors Switch Positions
The Relative Rotation Graph method visualizes sector shifts in real time, identifying which sectors are underperforming and outperforming a market index or benchmark. As of late 2025, Consumer Discretionary and Communication Services occupy the leading quadrant, while Technology rotates toward weakening. Healthcare sits in improving territory after lagging badly. This matters because shifts often precede economic changes by 3-6 months. The ISM Manufacturing PMI, Consumer Confidence Index, and yield curve shape provide early warning signals that help spot cycle turns early. Rising unemployment claims and declining corporate earnings guidance signal defensive rotation is warranted.
Consumer Discretionary surged roughly 40% from March lows near 173 to around 241 recently, demonstrating how sectors can accelerate once momentum builds. Tracking XLY alongside XLV and XLK reveals whether rotation is broadening or concentrated. Support and resistance levels matter too. XLY support sits at 230-232, while Healthcare faces resistance near 140. These technical anchors help confirm whether rotation is genuine or represents a temporary pullback.
Moving From Theory to Action
Understanding these patterns positions you to act before most investors recognize the shift. The next section walks through the specific economic indicators that signal when rotation is about to occur and how to track them in real time.
When to Act on Sector Signals
Timing sector rotations separates investors who capture 40% gains like XLY delivered from March to late 2025 from those who chase performance after the move ends.
Reading Economic Indicators in Real Time
The ISM Manufacturing PMI stands as your first real-time signal. When this index drops below 50, manufacturing activity contracts and early-cycle sectors lose momentum fast. Conversely, a reading above 55 signals robust expansion where Industrials and Materials accelerate. The Consumer Confidence Index matters equally. A sustained drop below 95 typically precedes defensive rotations into Healthcare and Utilities within 4-8 weeks.
Watch the yield curve inversion with intensity. The yield curve has predicted every recession since 1955, typically with a 6–24 month lead time. When the 10-year Treasury yield falls below the 2-year yield, rotation toward Utilities and Consumer Staples accelerates immediately because investors lock in higher yields before rates fall further.
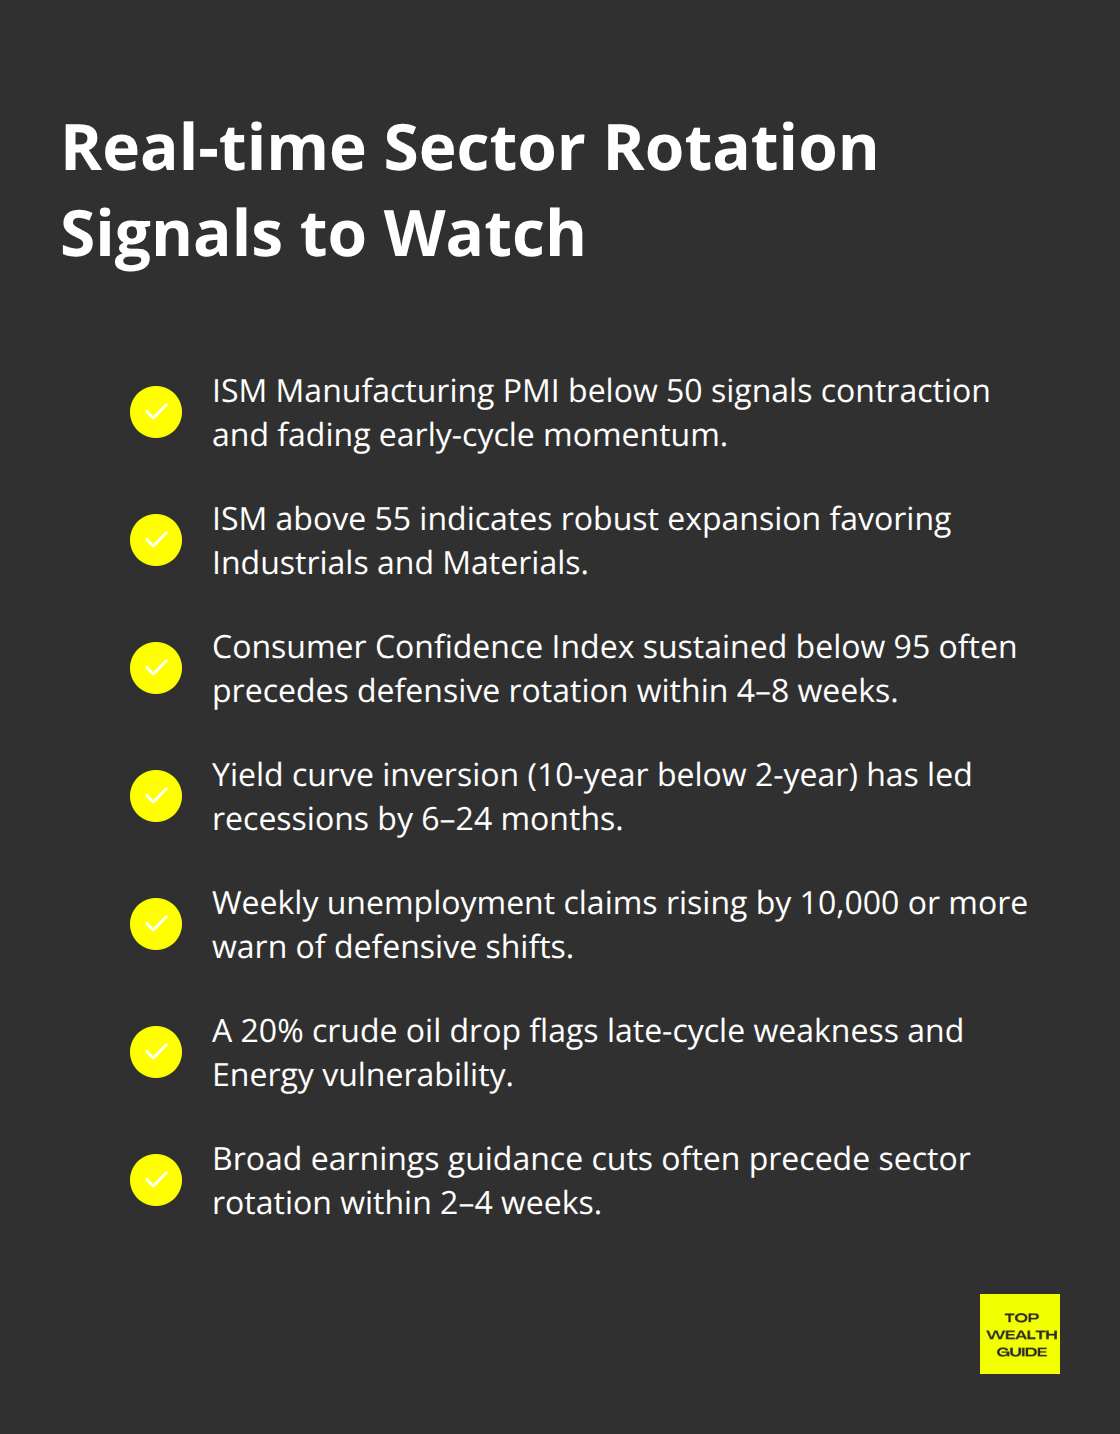
Oil prices and rig count provide another edge. A 20% drop in crude signals late-cycle weakness arriving, making Energy stocks vulnerable while defensive plays strengthen. Track unemployment claims weekly through the FRED database rather than monthly reports. Rising claims by 10,000 or more week-over-week often trigger defensive rotations before official employment reports release.
Corporate earnings guidance decline matters more than backward-looking earnings reports. When companies lower forward guidance across a sector, rotation away from that industry typically follows within 2-4 weeks.
Using Technical Tools to Confirm Signals
The Relative Rotation Graph shows exactly which sectors are improving versus deteriorating relative to the S&P 500. Healthcare sitting in the improving quadrant with XLV testing the 140 resistance level means this sector is building momentum, but waiting for a confirmed breakout above 140 on volume above 50 million shares prevents false entries. Consumer Discretionary and Communication Services occupying the leading quadrant confirms the current rotation is real and broadening beyond technology.
Use multiple confirming signals before trading. A single indicator misleads constantly. Instead, combine ISM below 50 with rising unemployment claims and declining earnings guidance before rotating into defensive sectors. This combination filter removes roughly 70% of false signals.
Avoiding the Timing Mistakes That Cost Returns
Most investors fail sector rotation not because they misread indicators but because they act on one signal and reverse when noise arrives. The biggest mistake is timing sector switches around news events rather than economic cycles. A Fed rate announcement might spike volatility, but it does not change whether an early-cycle or late-cycle environment exists. Sector rotation works on 3-6 month horizons, not daily price swings. Investors rotating in and out based on earnings surprises or geopolitical headlines waste commissions and tax drag while missing the actual rotation.
Another critical error is overweighting a single sector based on momentum. XLY surged 40% and sits near resistance, making it vulnerable to a 5-10% pullback. Holding 40% of a portfolio in Consumer Discretionary when it tests upper Bollinger Bands guarantees participating in the pullback too. Diversify across leading sectors by allocating 15% to XLY, 12% to XLC, and 10% to XLK while building 12% in XLV as it improves. This approach captures rotation leadership without overexposure to any single industry.
Managing Positions With Discipline
The final mistake is ignoring position management. Set stop losses at support levels. XLY support sits at 230-232, making a stop at 228 reasonable for new positions. If XLY closes below 228, the uptrend breaks and rotation may be reversing. Exit and reassess rather than hoping for a bounce.
Sector rotation delivers outsized returns only when entries follow confirmed signals and exits respect technical levels. The next section reveals how to construct a diversified portfolio that captures these rotations without exposing yourself to concentration risk or timing errors that derail most investors.
Building Your Sector Rotation Portfolio in Practice
Start With the Right Foundation
The theoretical foundation matters far less than execution. Start with a minimum of $10,000, though $25,000 provides enough capital to diversify across sector positions without creating excessive trading costs. Commission-free ETF accounts at brokers like Fidelity or Charles Schwab eliminate friction that kills returns through unnecessary fees. The eleven essential sector ETFs you need are XLF for Financials at 0.10% expense ratio, XLI for Industrials at 0.08%, XLE for Energy at 0.10%, XLU for Utilities at 0.10%, XLV for Healthcare at 0.10%, XLK for Technology at 0.10%, XLY for Consumer Discretionary at 0.10%, XLP for Consumer Staples at 0.10%, XLB for Materials at 0.08%, XLRE for Real Estate at 0.13%, and XLC for Communication Services at 0.10%. These funds track the S&P 500 Sector Select Industry indices and offer daily liquidity with minimal tracking error.
The expense ratios are negligible compared to active mutual funds charging 0.50% to 1.50% annually, which compounds into massive drag over decades. Start with three to four sector positions rather than attempting to rotate all eleven simultaneously. This prevents analysis paralysis and keeps weekly monitoring to 30-60 minutes.
Construct Your Initial Allocation
Current market conditions favor a barbell approach. Allocate 15% to XLY as it leads the market and sits near resistance at 242-243, providing exposure to Consumer Discretionary strength. Place 12% in XLC as Communication Services shares leading momentum. Build 10% in XLK for Technology exposure, though recognize this sector rotates toward weakening.
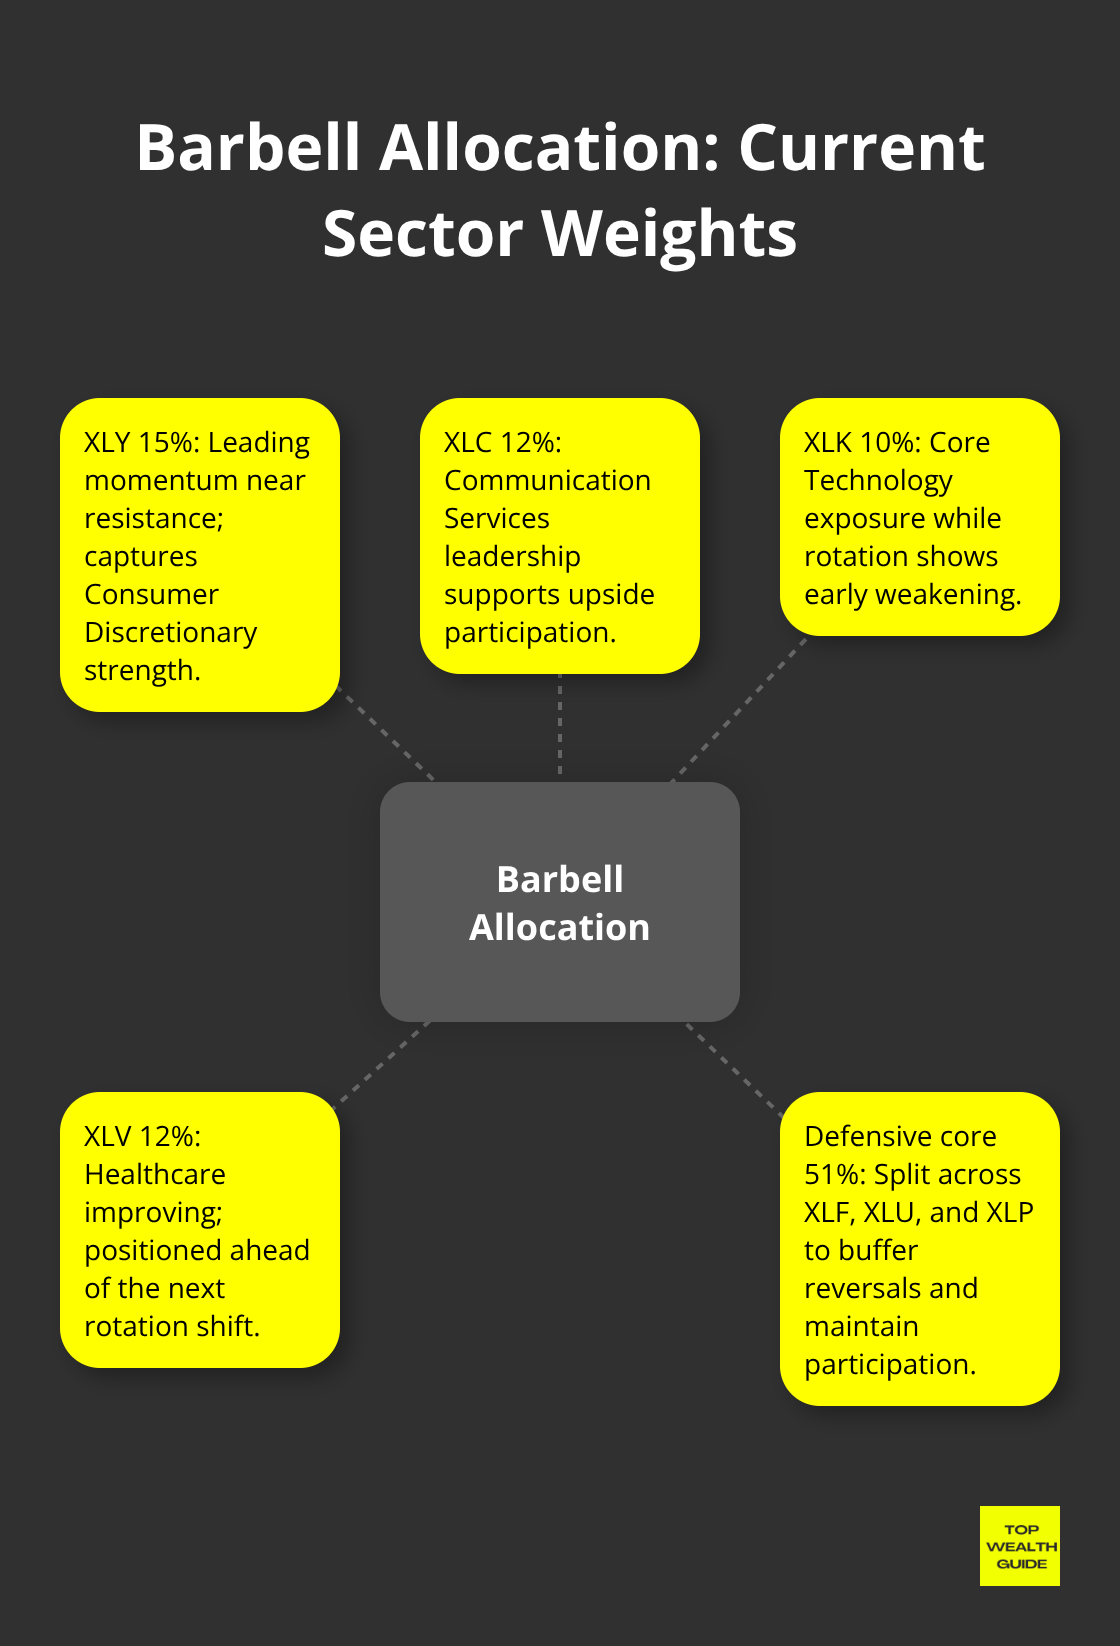
Most importantly, allocate 12% to XLV as Healthcare transitions from lagging into improving territory, positioning you ahead of the next rotation shift.
This allocation captures current leadership while hedging into the next phase. The remaining 51% sits in XLF, XLU, and XLP as a defensive foundation that protects against unexpected weakness. This structure prevents portfolio destruction during sector reversals while maintaining upside participation.
Rebalance on a Fixed Schedule
Rebalancing discipline separates successful rotators from performance chasers. Set quarterly rebalancing dates on March 31, June 30, September 30, and December 31 rather than rebalancing based on emotion or short-term price moves. If XLY surges and grows to 18% of your portfolio, trim it back to 15% and redeploy the proceeds into lagging sectors like XLV. This forces you to sell strength and buy weakness, which contradicts human instinct but generates consistent returns.
Monitor technical support levels weekly using price alerts rather than daily observation. XLY support at 230-232 and XLV resistance at 140 provide clear decision points. If XLY closes below 228, the uptrend breaks and rotation may be reversing toward defensive sectors. Exit the position and rotate proceeds into XLU and XLP. If XLV breaks above 140 on volume exceeding 50 million shares, increase Healthcare allocation from 12% to 15% by trimming XLK or XLY.
Apply Mechanical Rules to Eliminate Emotion
These mechanical rules eliminate emotion from decisions that cost most investors 2-3% annually through mistimed trades. Track performance quarterly against the S&P 500 and calculate your actual alpha. Over a full market cycle spanning 5-6 years, disciplined sector rotation should deliver outperformance. If you achieve less than 1% annually after accounting for trading costs and taxes, your indicators are failing and require adjustment.
The goal is not perfection but capturing the structural outperformance that sector rotation provides when executed systematically. Your quarterly reviews reveal whether your rotation signals work in real markets or whether you need to adjust your entry and exit criteria. Most investors fail because they abandon their system after one or two poor quarters rather than testing it across full market cycles.
Final Thoughts
Sector rotation transforms investing from guesswork into a systematic process that captures market returns most investors leave on the table. Disciplined rotation strategies have delivered roughly 2.8% annual outperformance versus buy-and-hold over three decades, and that compounds into meaningful wealth differences across a career. You now understand how economic cycles drive sector leadership, how to read the indicators that signal shifts before they happen, and how to construct a portfolio that participates in rotations without exposing yourself to concentration risk or timing errors.
The path forward requires three concrete actions. Open a commission-free ETF account and fund it with at least $10,000, though $25,000 provides better diversification. Build your initial allocation using the barbell approach: 15% in XLY, 12% in XLC, 10% in XLK, 12% in XLV, and the remaining 51% split across XLF, XLU, and XLP. Commit to quarterly rebalancing on fixed dates and weekly monitoring of support and resistance levels so you sell strength and buy weakness, the exact behavior that generates returns.
Sector rotation works because markets move ahead of the economy by 3-6 months, and most investors react too late. Track ISM Manufacturing PMI, Consumer Confidence Index, yield curve shape, and unemployment claims to position yourself ahead of the crowd. Visit Top Wealth Guide for additional resources on building wealth through systematic investing approaches that align with your financial goals.