
Most investors skip the hard work of investment research — and then act surprised when their capital goes up in smoke. At Top Wealth Guide we’ve watched deals implode because people missed the red flags a proper checklist would’ve uncovered (yes — the boring stuff matters).
This guide walks you through the exact areas you need to examine before committing your money. Financial health (cash flows, leverage, runway), market dynamics (size, growth, competition), and operational strength — we cover all three. Read it, do the work, and stop paying for other people’s sloppy due diligence… your future self will thank you.
In This Guide
Financial Health: The Numbers That Actually Matter
Start here – cash flow is survival; profitability is prosperity. Investors obsess over headline revenue growth and miss the sneaky story in the footnotes: you can scale like a rocket and still vaporize cash in the engine. Pull the last three years of audited financial statements and trace operating cash flow like it’s the pulse of the business. If operating cash flow slides into the red or drops while revenue climbs, that’s your first real red flag. A Bloomberg Law analysis of M&A due diligence found reviewing historical financials is still the single most common requirement across deals – and yet, people rush it. Don’t be that person. Look for rhythm. Revenue that spikes 40% one year and flatlines the next? Either a one-off customer or structural rot. Margins matter – compare gross, operating, and net margins over the three-year window. If gross margin holds while operating margin compresses, you’re watching efficiency disappear despite the top-line – a sign of operational strain or rising input costs they can’t pass on.
Debt and Cash Position Determine Your Real Risk
Open the balance sheet like a skeptical detective. Total debt, debt-to-equity, and cash on hand are the bones of solvency. Eighty percent debt-to-equity in a boring, regulated industry – maybe manageable. Same ratio in a cyclical business – borderline suicide. Calculate the interest coverage ratio (EBIT, EBITDA, or EBIAT ÷ interest expense). If the firm only covers interest 1.5x, a 10% revenue dip can trigger covenant breaches or force ugly refinancing. Check maturities – if 60% of debt comes due in the next two years, model that refinancing risk into every scenario. Cash runway isn’t academic. Divide cash on hand by monthly cash burn (operating expenses minus operating cash flow). Eighteen months runway? Fine – until markets tighten and your buffer evaporates.
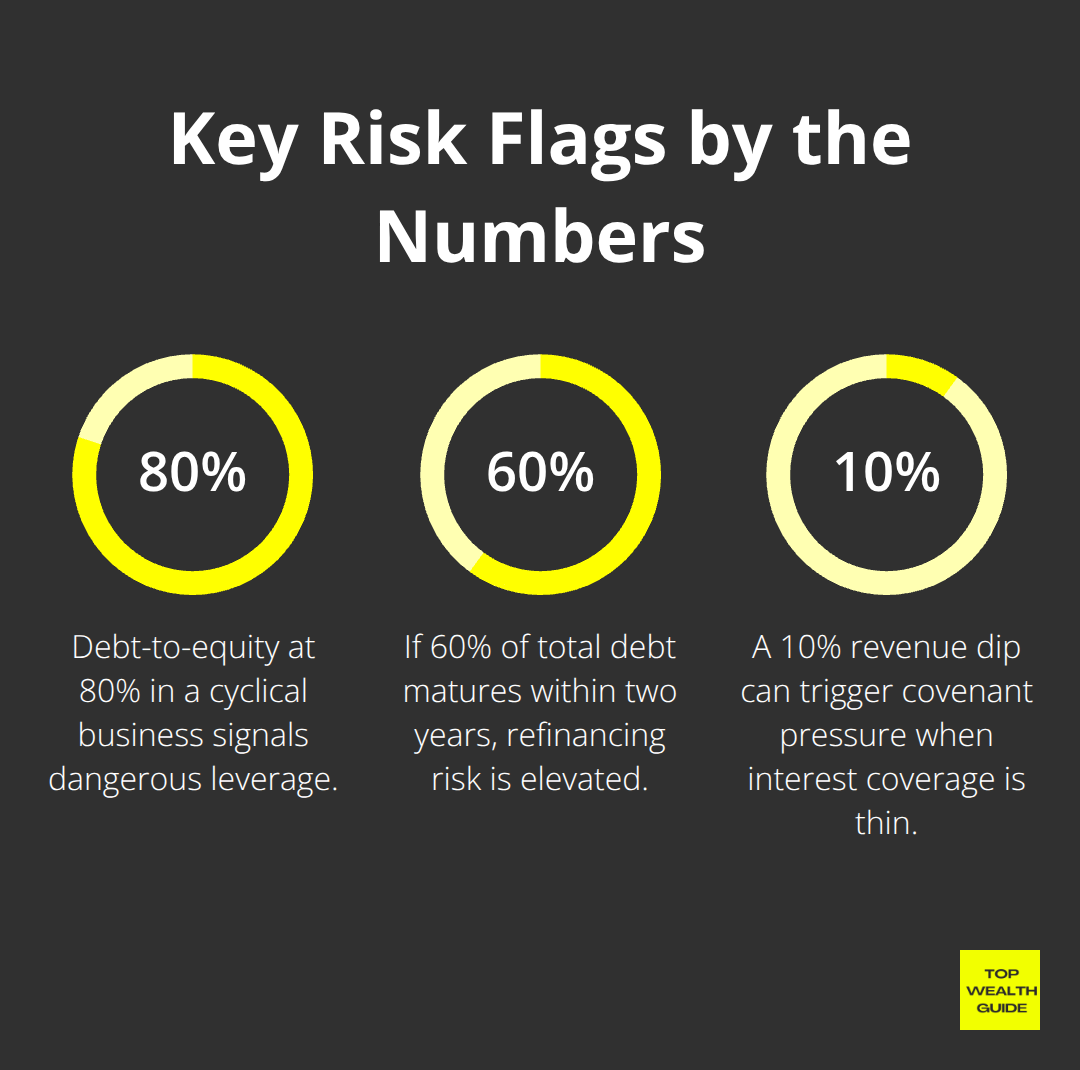
For platform buys or tuck-ins, this math becomes existential because you inherit those obligations when the deal closes.
Revenue Quality and Competitive Durability
Not all revenue behaves the same. Customer concentration is quietly lethal – one client responsible for 30% of revenue leaves, and your investment thesis collapses like a poorly run Q4. Demand a top-10 customer list and contract values. Churn rates – obsess over them. A SaaS outfit with 95% retention sounds solid until you realize they’re losing midmarket customers while landing a few enterprise deals; the mix shift masks underlying decay. Read the revenue recognition footnotes – are they booking upfront or ratably? Deferred revenue on the balance sheet is real cash already collected; treat it as a strength. Drill into gross margin trends by segment if possible. One product line shrinking 15% annually while another grows 8% – that divergence tells you where competitive pressure or market change is actually happening. Then benchmark – compare their margins and growth to two or three direct competitors from public filings. If this company posts 40% gross margin in an industry where peers average 50%, either they’re losing share or they have structural handicaps – and you need to know which before you write a check.
What Comes Next
Financials show history – not destiny. That future view is market analysis. Understand industry growth trajectories, who your company actually competes against, and regulatory forces that could rearrange the playing field. These external factors often matter more than last year’s profitability. In short – read the statements, but don’t stop there. Model what could go wrong, what could go spectacularly right, and price in the gap.
Market and Competitive Analysis: What Actually Threatens Your Investment
Industry growth rates are seductive – they give you a warm, fuzzy headline. But beneath the headline is a dog-eat-dog battlefield. Start by pulling the total addressable market (TAM) from reputable outfits – Gartner, McKinsey, credible industry research firms – not vendor marketing pretending to be objective. A 12% market growth rate sounds fine until you realize three competitors are siphoning share and one player owns 40% of the pie. Suddenly that 12% is meaningless if your target is losing ground.
Demand specifics – what slice of the pie does this company actually service, and how fast is that slice growing? A healthcare IT company in a 15% growth market overall might be focused on rural clinics – a segment that’s contracting. So headline growth is irrelevant to their addressable opportunity. Cross-check market-size claims with SEC filings from public peers. If Competitor A is reporting 8% year-over-year growth in a market supposedly expanding at 20% – someone’s numbers don’t add up. And don’t ignore customer acquisition economics: if CAC is rising (say, 40% higher) while market growth decelerates from 18% to 10%, competition is heating up – and acquiring customers post-close will be more expensive and harder.
Competitive Position Determines Your Margin of Safety
Competitive analysis isn’t a headcount exercise – it’s figuring out who takes your customers, and why. Ask for a granular win-loss analysis from sales – not a glossy positioning slide, but real data: who beat them last quarter, at what price, for what reasons. If 35% of lost deals go to a single rival on price, the problem is cost structure – and that’s fixable only if you can credibly pivot margins. Benchmark pricing, features, and customer acquisition spend against two direct competitors using public info and user reviews (G2, Capterra).
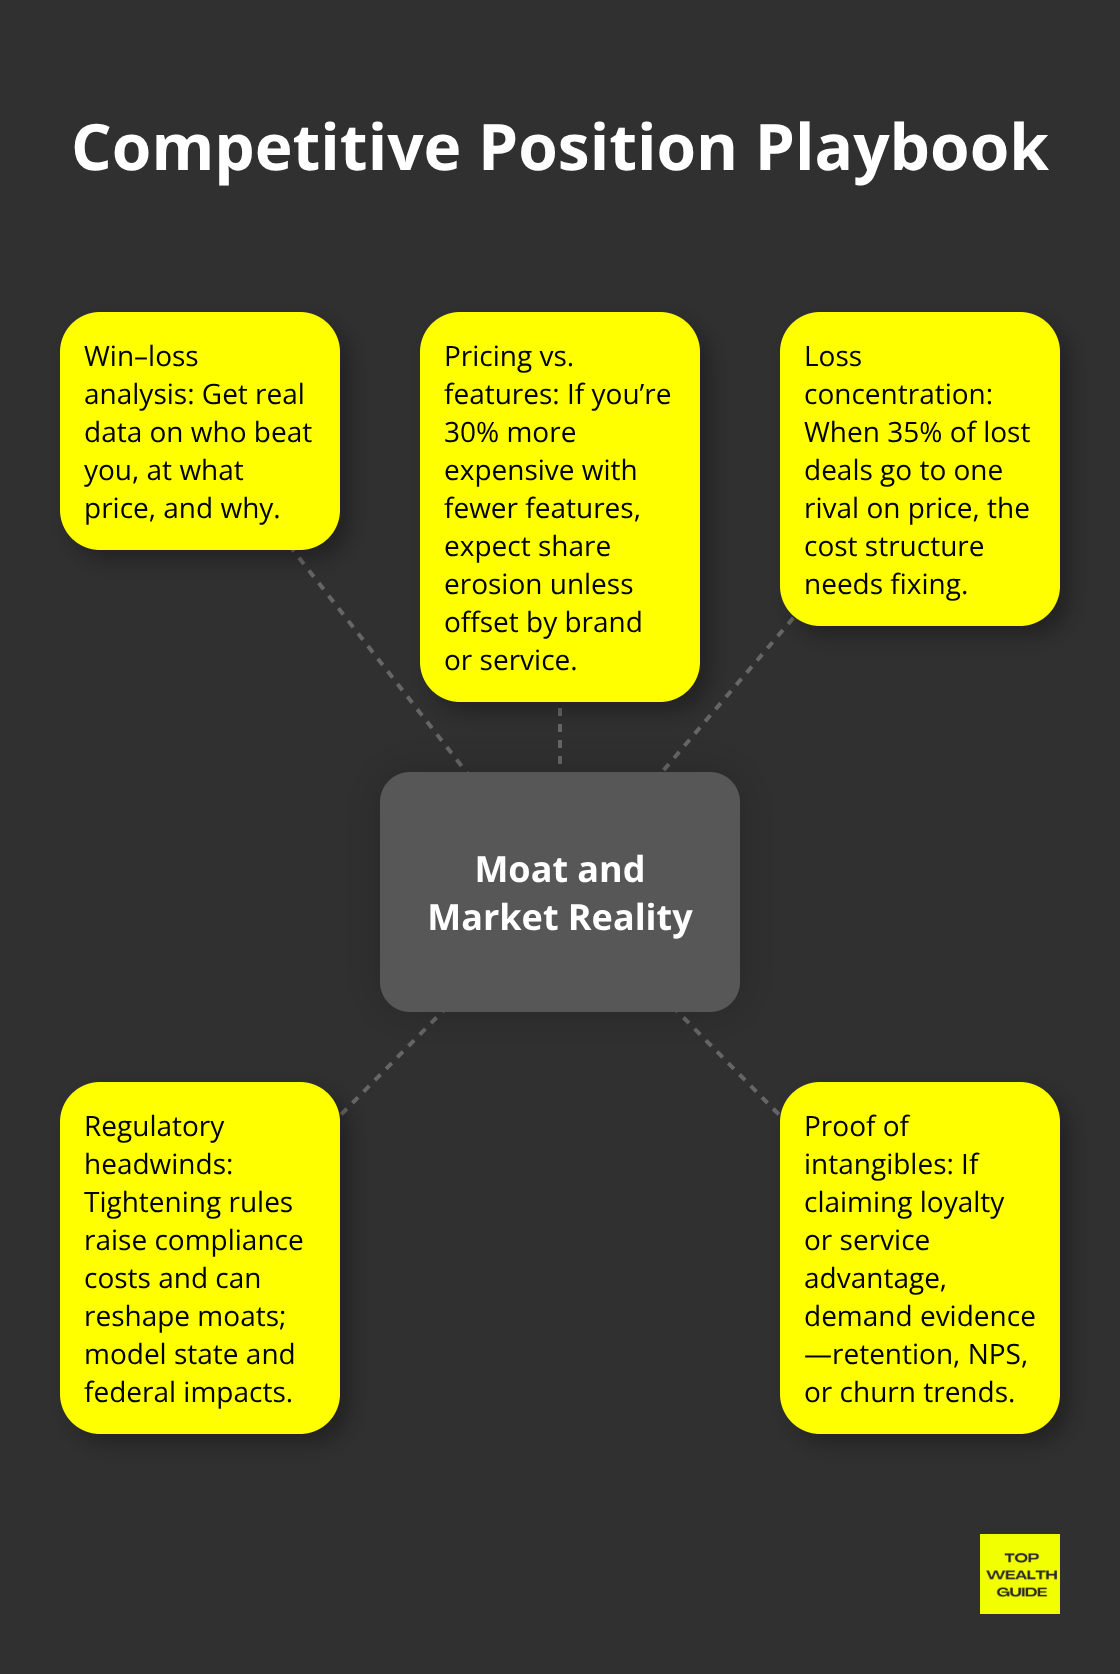
If you’re 30% more expensive with fewer features, market share will erode unless you’re winning on something less tangible – brand, service, customer loyalty – and you need evidence of that.
Regulatory changes rip competitive moats faster than most models assume. Spend time on agency sites, pending legislation, and industry association alerts tied to the company’s jurisdiction and sector. A fintech operating in three states faces wildly different compliance loads if federal rules tighten – model that. Healthcare, financial services, telecom – these verticals live and die by regulation. Proposed changes show up months in advance (the Federal Register and industry bodies are your friends). Regulatory compliance costs rising annually across sectors – bake that into margin forecasts.
IP and patent risk matters in tech, biotech, manufacturing. Run a quick USPTO patent search; look for pending litigation. One invalidated patent can vaporize a moat – especially in pharma or software where IP = defensibility.
Legal Exposure Destroys Deal Returns
Legal diligence is not a paperwork checkbox – it’s mapping every path that leads to litigation, fines, or shutdown. Pull litigation records from state and federal courts for the last five years. A modest product-liability suit in one jurisdiction can spark a national class action if it’s not contained. Environmental liabilities are a classic stealth killer in manufacturing, real estate, or chemical distribution. Phase I environmental assessments cost $1,500 to $6,000 – cheap insurance for uncovering contamination that could cost millions to remediate. Skip it and you inherit the problem at close.
Employment litigation and wage-hour claims are on the rise – check state labor boards and EEOC complaints. Multiple wage-and-hour settlements suggest systemic HR compliance failure (and more suits are likely). IP disputes can be ruinous: one infringement claim might look containable until you realize litigation costs $3–5 million and management is distracted for years.
Review top customer and vendor contracts for indemnities, termination rights, and change-of-control clauses. A major customer that can walk if ownership changes is a deal-killer – or at least forces pre-close renegotiation. Confirm the company holds all required licenses, permits, and certifications (staffing firms need state licensing, healthcare providers need accreditation, money transmitters need federal registration). Missing or lapsed credentials can shut operations down overnight.
With market position and legal exposure mapped, operational strength becomes your next lens – can the management team and systems actually execute on the opportunity you think you’re buying?
Operational and Management Review
Management quality separates winners from disasters. You can inherit a brilliant market position and torch it with mediocre execution-or find a founder who actually knows how to build, scale, and stay sane, and compound returns for years. Start with founder and CEO tenure-how long have they sat in the hot seat, and what did they actually deliver before this? A CEO who hops through three jobs in five years, leaving after two each time, screams either restless energy or being shown the door. Cross-check LinkedIn bios against SEC filings and press archives-if the biography boasts fifteen industry years but their first payroll stub is from four years ago, treat credibility as suspect.
Demand a full org chart with tenure for the top fifteen people. High churn in finance, ops, or engineering is not “culture,” it’s chaos-and you’re buying that chaos. The CFO and COO matter more than slick slide decks. If either has been in post less than eighteen months and predecessors lasted under a year, expect weak accounting controls and post-close surprises. Ask for board composition-are independent directors seasoned operators or the founder’s golf buddies? One adds muscle, the other adds invitations.
For platform deals or bolt-ons, depth below the founder is critical-can tiers two and three run the business if the top person exits? Interview the top five managers yourself. Ask blunt questions about bonus mechanics, equity vesting, and retention promises post-close. If the CEO owns 60% and walks after year one, your integration plan evaporates.
Systems and Technology Infrastructure
Operational systems and supply-chain resilience decide whether the company weathers stress-or implodes. Insist on the last three years of IT audit reports and cybersecurity assessments-SSAE 18 or SOC 2 reports if they touch customer data. No third-party security audit on file? Assume holes, and budget remediation. Identify the mission-critical software: ERP, CRM, accounting platforms, bespoke tools. If key processes live in spreadsheets or arcane legacy systems no one fully understands, integration and scale become nightmares.
Ask about breaches or ransomware in the last five years-and demand narrative, not a “no” checkbox. A company that paid a $200,000 ransom two years ago and didn’t materially upgrade defenses is a ticking liability.
Supply Chain Concentration and Resilience
Map the top ten suppliers and their concentration-if a single supplier supplies 35% of COGS, a hiccup halts production. Check supply chain concentration risk-are contracts locked long-term, or month-to-month? Rising input costs from concentrated suppliers compress margins faster than pricing power rescues you. Pull production capacity utilization for the last two years: 65% utilization = spare capacity (a hidden asset); 92% utilization = immediate capex required-model that into returns.
Verify supply-chain insurance or contractual protections for key-vendor failure. For manufacturing and logistics, demand the last twelve months of on-time delivery metrics. Consistent misses aren’t “operational quirks”-they’re a customer-retention issue that will show up in churn and lost revenue.
Final Thoughts
You’ve just marched through the three pillars of serious investment research: financial health, market dynamics, and operational strength. Each pillar matters-miss one and you’re flying blind. Most investors rush this (or hand it off to advisors with conflicting incentives), then wonder why deals underperform… or explode.
Pull three years of audited financials-then trace cash flow like it’s a crime scene. Benchmark margins and growth against real competitors (not press releases). Sit down with the management team-verify resumes, stories, and track records.
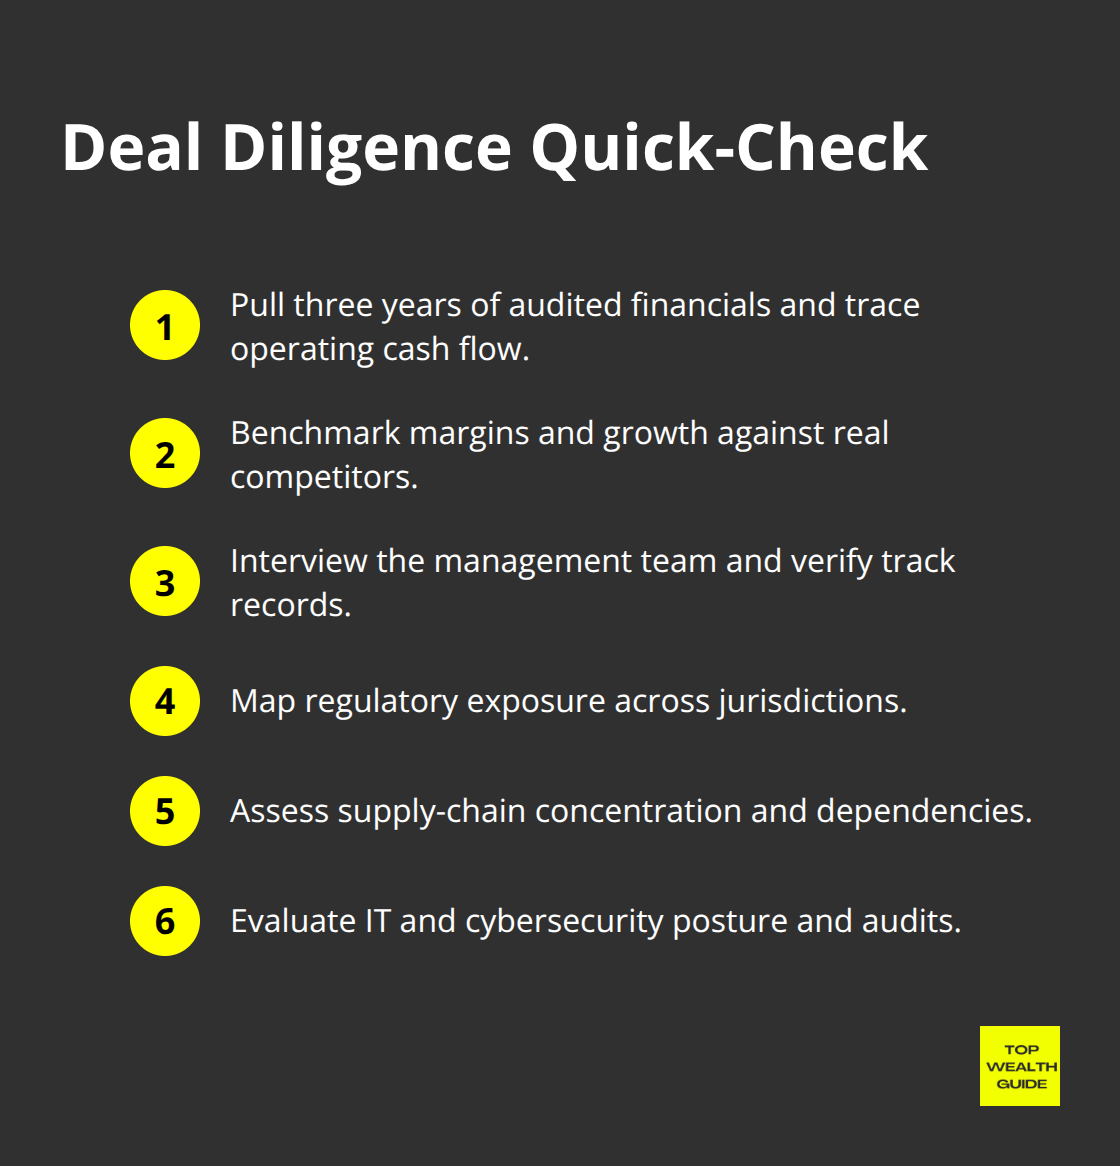
Map regulatory exposure. Map supply‑chain concentration. Assess IT and cybersecurity posture. These aren’t academic exercises-these are the difference between a sound investment and a headline you regret.
Build a simple decision framework once the facts are in: what could go catastrophically wrong? What would have to be true for the upside to materialize? Where are you most uncertain? Price that uncertainty into your valuation and your hold‑period expectations. If you can’t articulate why you’re buying-beyond a sexy growth number or a charismatic founder-walk away. There will be other deals.
Visit Top Wealth Guide for more frameworks and practical strategies to strengthen your investment decision‑making.