
Smart investors — they don’t just leap into opportunities with their eyes closed. Nope, they’ve got a secret weapon: market research. It’s the dividing line between the winners and those folks who pour money down the drain chasing gut feelings or the latest “sure thing.”
Here’s the deal: At Top Wealth Guide, we’re all about deep dives over wild guesses. Why? Because a solid research process isn’t just a safety net — it’s your roadmap to finding those golden opportunities without tripping over the blunders that can bleed your portfolio dry.
In This Guide
What Makes Market Research Actually Work
Let’s chat about how real market research flips data into gold – or at least smart investment plays. The Federal Reserve Economic Data – yes, that Fed – cranks out over 9,700 data series. Why? To arm you for the battle of market analysis. See, the secret sauce isn’t just picking stocks – it’s about the groundwork most investors ignore.
Define Your Money Blueprint First
Start with the plan, folks. Your timeframe and risk appetite are your GPS and seatbelt. Look, someone playing the long game (20+ years) can ride the waves of market chaos, but a five-year guy… roadkill during a storm. Vanguard research hammers this in – you’re boxed in by your time and risk zone. Before you even peek at stocks or sectors, scribble your financial goals, investment timeline, and your “I’ll pull the ripcord here” loss percentage.
Track the Numbers That Drive Results
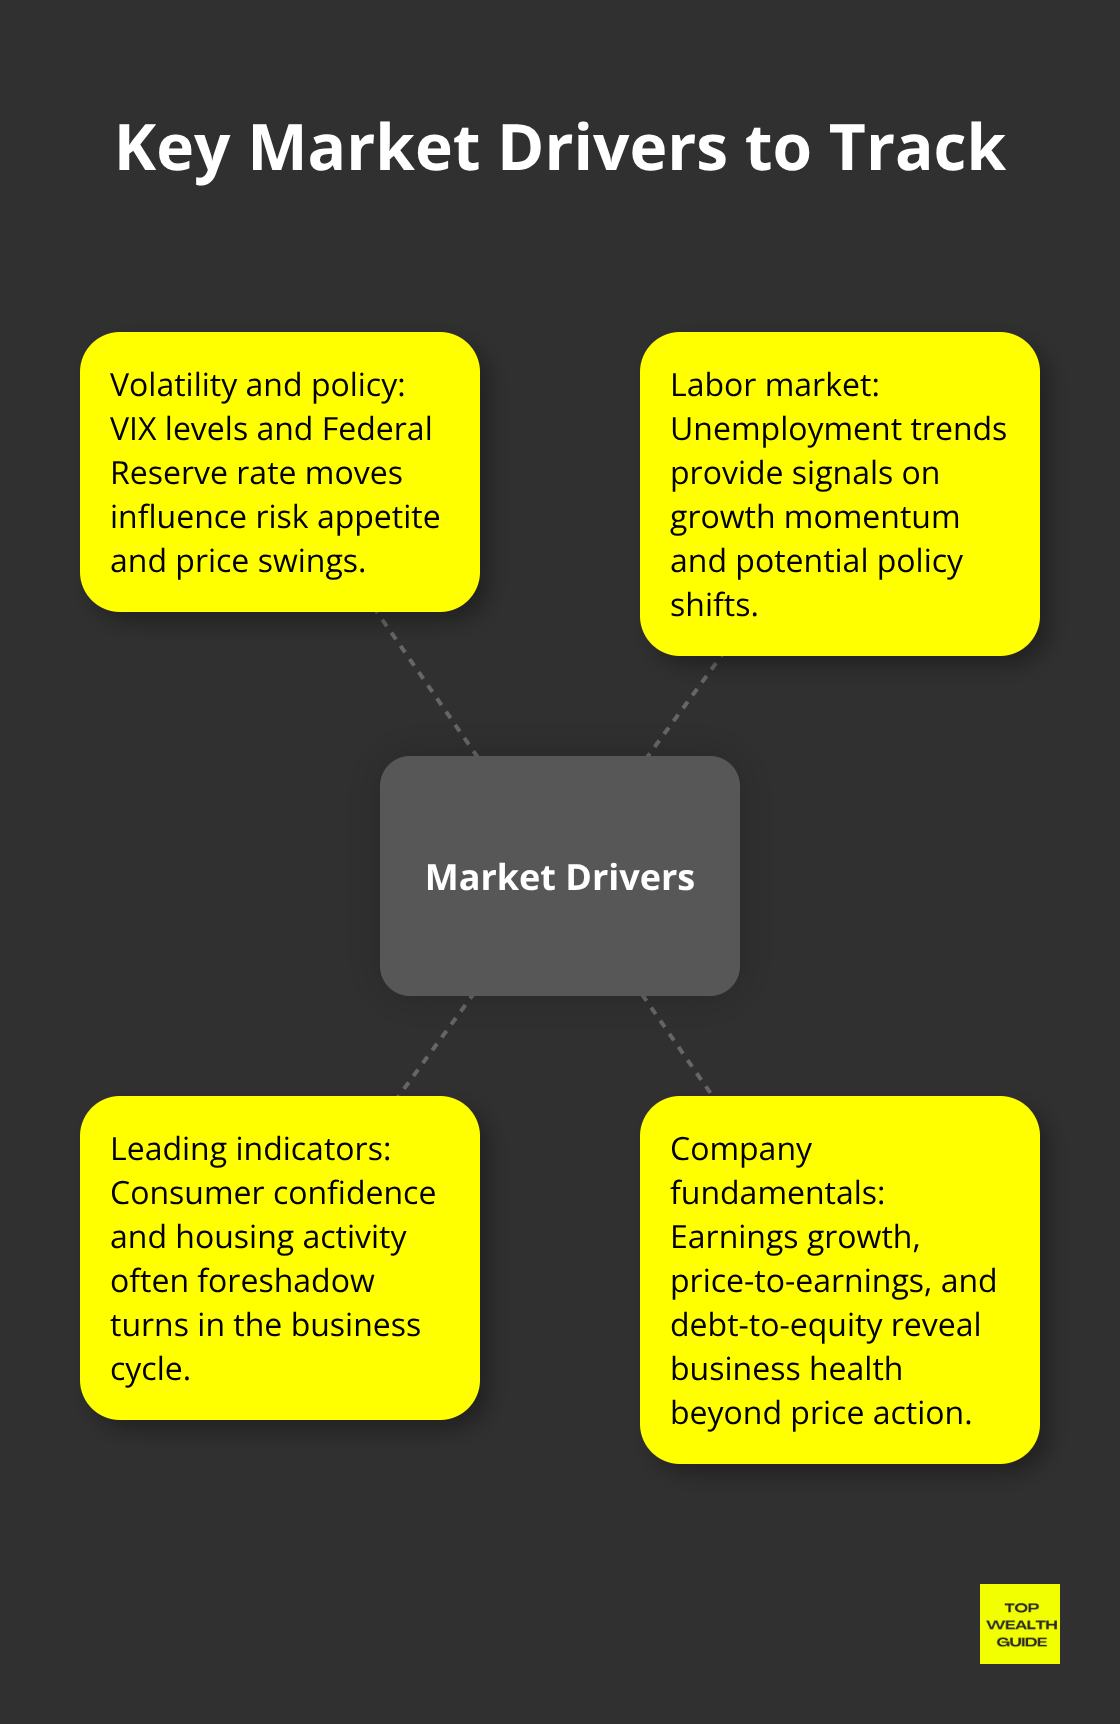
Everyone loves numbers, but not all digits mean the same. It’s like a secret code – only a few matter. The Chicago Board Options Exchange Volatility Index, jobless rates, and what the Fed does with rates… that’s the trifecta. Goldman Sachs backs me on this. Stuff like consumer confidence and housing bumps give you a head start – early warnings for shifts. But for companies? Earnings growth, price-to-earnings, and debt-to-equity ratios… those are your health check.
Way more telling than stock prices alone.
Choose Your Analysis Method and Master It
Top-down, bottom-up – it’s like picking a sword or a shield. Go top-down? You’re scanning the economic horizon and zooming in on investments. Bottom-up? You’re the detective in corporate books, working outward. McKinsey data shows funds play this game differently. Big buyouts? Smaller performance gaps but still significant. Decide based on your superpowers – economic forecasting for top-down, or financial statement sleuthing for bottom-up. Each shines in its own market saga, but smart asset allocation is the plot twist you need regardless.
Your brainwork here – laying the groundwork – decides which weapons you wield in your research arsenal.
Which Research Tools Actually Move the Needle
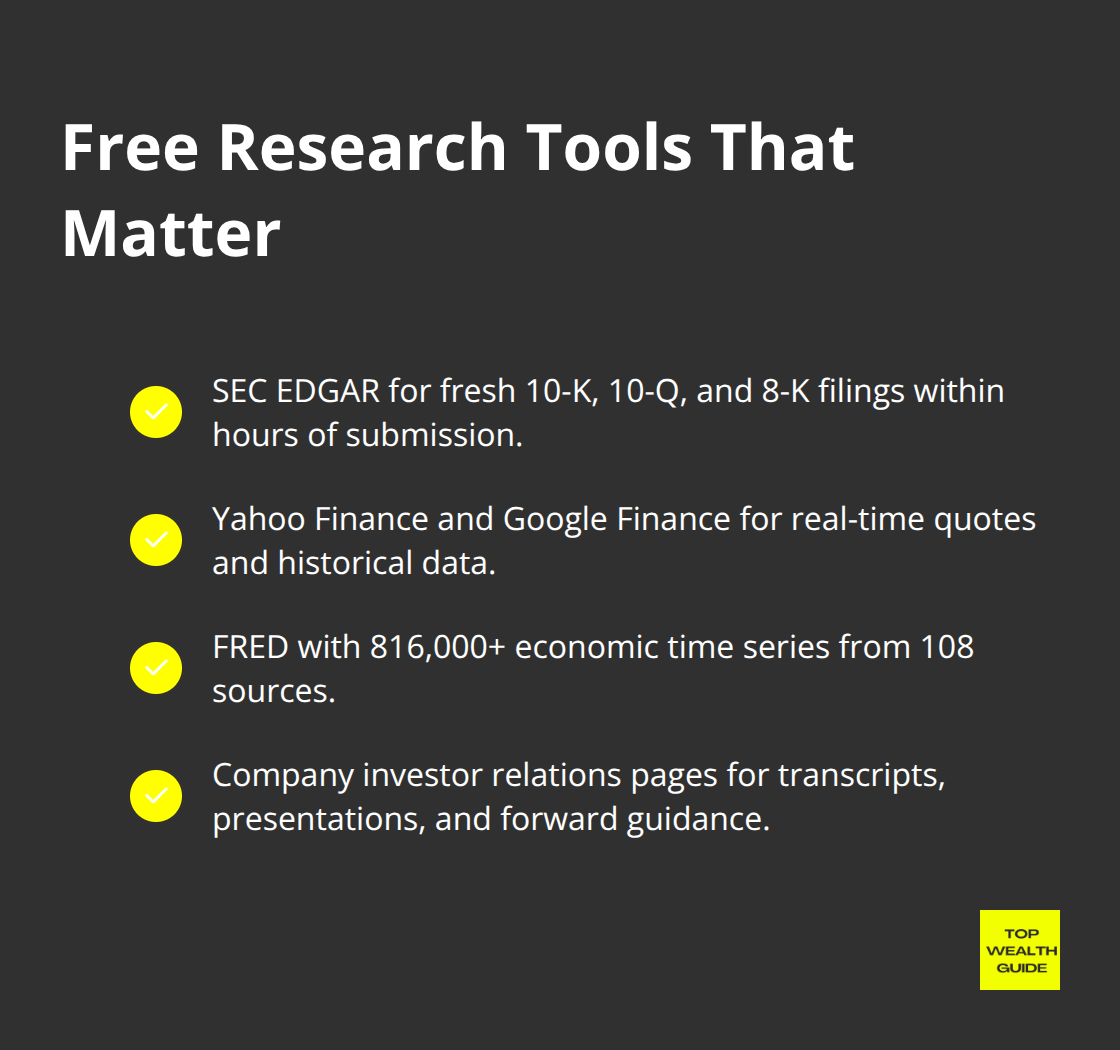
Let’s break it down – free resources pack way more punch than most investors realize. Step into the SEC’s EDGAR database … it’s like a treasure trove for public company filings, landing there just hours after submission. We’re talking 10-Ks, 10-Qs, and 8-Ks that spill management’s beans, spill the risk factors, and lay out the financials before Wall Street spins its tales. And hey, Yahoo Finance and Google Finance? Serving up real-time quotes and historical data on the house. Not to mention, the Federal Reserve Bank of St. Louis FRED database crams over 816,000 economic time series from 108 sources – employment data, inflation metrics, GDP growth – the stuff that fuels market cycles. Wanna hear it straight from the horse’s mouth? Company investor relations pages hold the goods: earnings call transcripts, presentations, and forward guidance direct from management.
Premium Platforms That Justify Their Price Tags
Alright, so Bloomberg Terminal costs you about $24K a year, but it’s like the Swiss Army knife of data, news, and analytics that retail platforms just … can’t. Morningstar Premium at $249 annually offers beefy stock analysis, portfolio tools, and fair value estimates minus the fluff. Then you’ve got FactSet and Refinitiv Eikon shooting real-time market data and earnings estimates your way, plus the ability to screen over 50,000 securities faster than you can say “investment opportunity.” Oh, and they pull in analyst ratings from the titans – Goldman, Morgan, JPMorgan – serving up Wall Street’s takes before the retail crowd even blinks.
Social Media Intelligence That Beats Traditional News
Social media’s a beast – Twitter’s financial gang is all about speed over traditional media. So, follow @DeItaone for those hot-off-the-press news alerts, @zerohedge if you want the spicy contrarian takes, and CEO accounts for some raw, unfiltered updates right from the corporate front lines. Reddit’s r/SecurityAnalysis and r/investing communities? They’re the Sherlock Holmes of earnings reports, sharing due diligence that sometimes catches trends way before the big wigs do. Meanwhile, LinkedIn posts from portfolio heavyweights like Berkshire and Bridgewater expose the investment philosophies and market outlooks that are, frankly, money. StockTwits? Check those sentiment indicators – they’re like a crystal ball for smaller-cap stocks’ investor moods.
News Sources That Actually Matter
In the realm of financial news, not all sources are created equal. The Wall Street Journal’s your blockbuster killer for corporate scandals and merger scoop that slam stock prices in minutes. Bloomberg News dishes out earnings previews and those Federal Reserve insights everyone’s glued to. Reuters is your go-to for global economic data drops and central bank moves that tweak currency and commodity markets. And don’t forget CNBC’s “Fast Money” and “Mad Money” – they sway retail investor moods, with Barron’s weekend analysis shaping the Monday trades.
These tools? They’re your research foundation. But let’s be clear – raw data’s just noise unless you’ve got a system to make sense of it. Understanding your risk tolerance is clutch to shaping your opportunity filter, and knowing which stocks to target is how you turn research into something actionable – and profitable.
How to Research Like a Pro
Start with industry analysis-because, let’s face it, sectors move before individual stocks do. The S&P 500 sectors? Yeah, those utilities companies fit snugly in the GICS utilities sector. Check out quarterly GDP growth by sector from the Bureau of Economic Analysis… manufacturing, services, tech-they’re the usual suspects leading economic expansions. Meanwhile, the Federal Reserve’s Industrial Production Index monthly releases will tell you which industries are gearing up. Consumer discretionary stocks like Amazon and Tesla? They’re your barometer for economic confidence shifts, while defensive sectors like healthcare and consumers stay the course during downturns.
Analyze Company Financials That Matter
Let’s talk revenue growth-’cause that matters more than stock price shenanigans. The S&P 500 is pegged to bring in 5-7% annually over the next decade, according to the all-knowing analysts. Now, zoom in on gross margins first-anything north of 40%? That’s your signal for pricing power and competitive moats. But watch those debt-to-equity ratios-anything above 2.0 smells like trouble unless you’re in utilities or REITs, where high leverage is part of the game. Free cash flow over earnings, folks, because cash flow? It doesn’t lie. Compare price-to-sales ratios within industries-software companies sit at 8-12 times sales, yet retailers barely pass 2 times sales.
Spot Market Entry Points
Uh-oh, volume spikes? They point to institutional money flowing like a tsunami, in or out. If trading volume surpasses the 50-day average by 200% or more, count on significant price movements within the next 5-10 trading days.
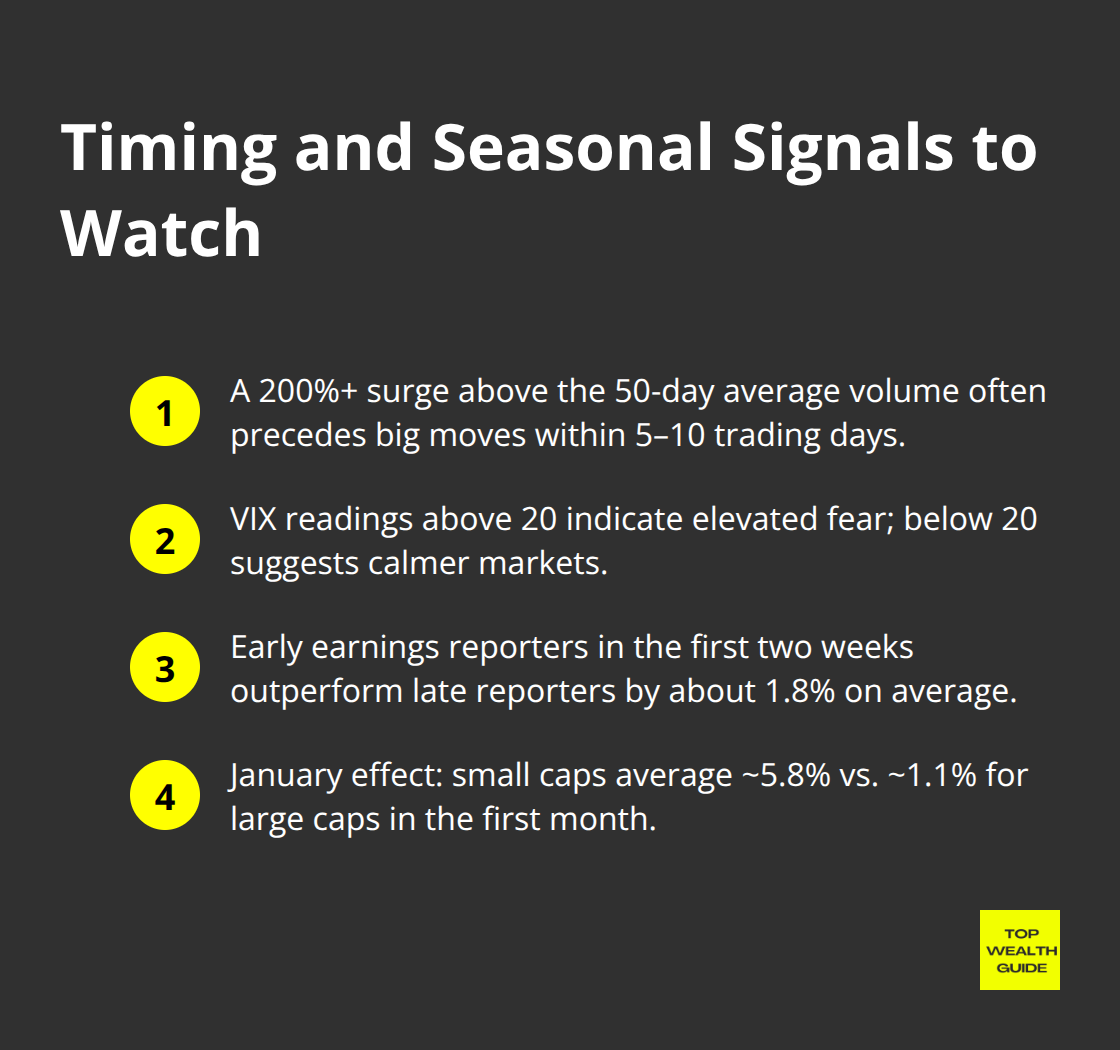
Keep an eye on the VIX-anything above 20 signals market fear, while readings under 20? That’s market nap time. And don’t downplay earnings season timing-early birds reporting in the first two weeks outperform the tardy ones by 1.8% on average, says Thomson Reuters data. January effect? It’s happening, especially for small-cap stocks (that means 5.8% average returns vs. 1.1% for large caps in the first month).
Final Thoughts
Market research is what sets apart investors who know what they’re doing from those who are just rolling the dice. Seriously, the numbers don’t lie – investors who dive deep into research before making their moves outperform those who play it by ear by about 3-4% annually. The secret sauce? Three things: having clear investment goals, trusting your data sources (no sketchy shortcuts here), and sticking to a systematic analysis game plan.
Let’s talk about the classic blunder – analysis paralysis. You know the type: they spend months drowning in research but never actually pull the trigger. Meanwhile, compound growth opportunities? Poof. Gone. Then there’s confirmation bias, sneaky as ever – it’s when you only listen to info that backs up what you already believe, instead of asking yourself the hard questions (spoiler: this usually tanks your investments).
Ready to kickstart your market research? Here’s how. Get that free SEC EDGAR account up and running, then dive into those 10-K filings for companies that catch your eye. Also, pro tip: set up Google Alerts for big economic signals like unemployment rates and GDP growth. We at Top Wealth Guide are here with practical investment strategies and tools to help you build real wealth, informed decision by informed decision.